Core PR & Social Measurement
Even after all these years, fetching basic metrics is still a real pain for many PR teams.
Through a mix of credible third party and proprietary data, Releasd fully automates this process, saving time and making it much easier to measure the fundamentals.
Reach, Views &Unique Visitors
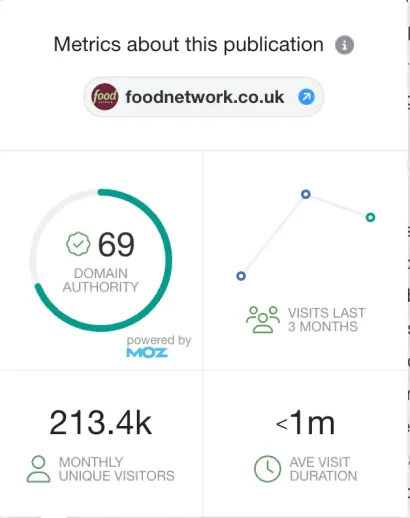
Simply add links, and Releasd will automatically provide publication Reach and Unique Website Visitors.
Plus, see Average Dwell Time and popularity trend data - all sourced from the very latest Similarweb data.






37.8k
COVERAGE
VIEWS
286k
MONTHLY
VISITS

103
SOCIAL
ENGAGEMENT


Food Network
10 delicious summer salad recipes
Summer is the perfect time to explore the vibrant and fresh flavours of seasonal produce, and what better way to do that than with a tantalising salad? But these aren’t your ordinary garden-variety greens. Our collection of ‘10 Delicious Summer Salad Recipes with a Twist’...






Coverage Views

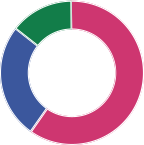
On Website

Open Social
Dark Social

27.8k

Domain Authority
Releasd connects with Moz for global Domain Authority data.
This key PR metric helps to establish the relative influence of a publication within its category.
PR teams can see DA per article, get an average and also visualise scores across all publications.







Domain Authority


Pieces of coverage
90-100
80-90
70-80
60-70
50-60
40-50
30-40
20-30
10-20
0-19

Average Domain Authority
72

Open & Dark Social Engagements
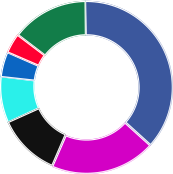
Open social platforms like Facebook, X and Reddit share engagement data via an API. Dark social platforms do not, but represent the vast majority of social engagement globally.
Releasd is the only platform to include both open and estimated dark social data to provide a wider picture of coverage performance.


100
90
80
70
60
50
40
30
20
10

👍
❤️
😂
😮
🙁
😡
Facebook Reactions


Social Engagement


X

TikTok


YouTube

Dark Social
27.8k
Social Media Analytics
Measure the impact of LinkedIn, YouTube, Instagram, TikTok, Facebook & X posts.
Releasd will display social posts and fetch live metrics including Followers, Engagements, Views and more. These can be displayed on a post level and also totalled.
Metrics can be added for Stories when uploaded as images or video clips.






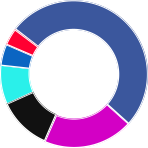
Social Posts by Platform


X

TikTok


YouTube
304


9.6k
218

47k

143.6k


Rory B
Head of Digital Marketing, Sudobiz
45 548 followers
I’ve always admired people who can whip up slick, professional-looking videos. I am not one of those people. My e diting skills max out at trimming clips and hoping for the best.
But today, I tried an AI video app, and I’m genuinely blown away. I typed in a rough idea, and in a few minutes, it generated a script, stitched together visuals, added a voiceover (in multiple accents, if I wanted), and even threw in captions. No timeline, no ...See more

1:25


supercool





3,523Likes
No editing. No timeline. No hours of tweaking. I typed a rough idea, and boom—AI generated the script, visuals...

Md Hera
@naimurhera2

Follow

I typed a rough idea, and AI did the rest—script, visuals, voiceover, captions. No timeline, no manual cuts, just done.
It wasn’t perfect, but for zero effort? Wild. If AI can do this now, where are we headed next?
Anyone else tried AI for video? Thoughts? 👀 #AI #VideoEditing #Tech

5:10 PM · Mar 28, 2024


1.3k

Reply

Share
Read more on X
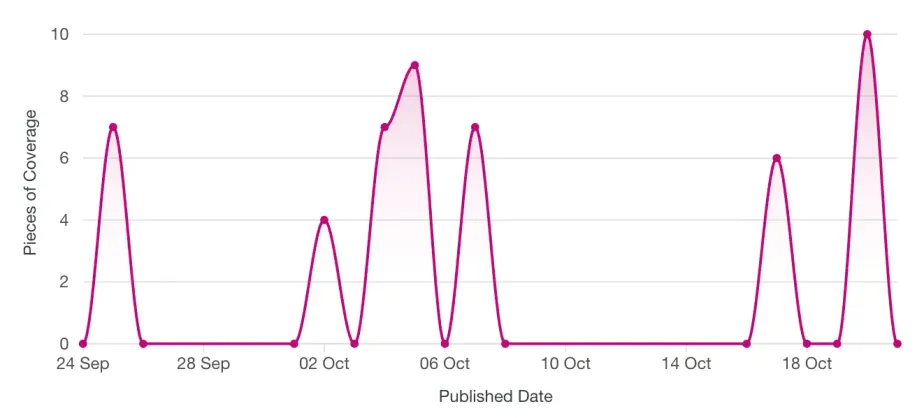
Coverage & Social Over Time
Visualise peaks and troughs of coverage and social media over time, automatically generated based on publish dates.
Demonstrate how proactive campaign activities and events - or seasonality and other external factors - influence the timing of coverage.




Online Coverage Over Time

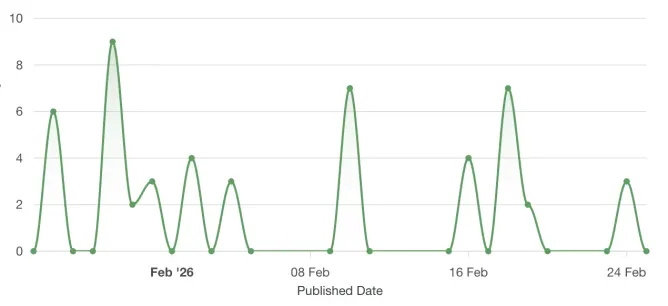
Social Posts Over Time
Add Print & Broadcast Metrics
Input figures for print coverage and the system will save the data to ensure easy re-use.
Audio and TV coverage can be added too - simply enter viewership or listenership figures and totals will automatically be calculated.




Print Coverage
126.7k
CIRCULATION





862.4m

Total TV Viewership

1.3m

Total Listenership
Automated Coverage Totals
Get totals for each type of coverage - online, social, print, audio and TV.
Choose which metrics to include in a report, from top line figures to granular breakdowns for each coverage type.




Total Online Coverage
192

Total Print Coverage
23

Total Social Posts
64

Total Broadcast Coverage
12

Automated Data Refreshes
Online coverage and social media metrics automatically update to ensure live, accurate data.
Online coverage metrics continue to update for a period of seven days to account for further social engagements. Social media post data is refreshed when reports are published.



9.6k
218

47k

143.6k


Rory B
Head of Digital Marketing, Sudobiz
45 548 followers
I’ve always admired people who can whip up slick, professional-looking videos. I am not one of those people. My e diting skills max out at trimming clips and hoping for the best.
But today, I tried an AI video app, and I’m genuinely blown away. I typed in a rough idea, and in a few minutes, it generated a script, stitched together visuals, added a voiceover (in multiple accents, if I wanted), and even threw in captions. No timeline, no ...See more

1:25


supercool


3,523Likes
No editing. No timeline. No hours of tweaking. I typed a rough idea, and boom—AI generated the script, visuals...

Md Hera
@naimurhera2

Follow

I typed a rough idea, and AI did the rest—script, visuals, voiceover, captions. No timeline, no manual cuts, just done.
It wasn’t perfect, but for zero effort? Wild. If AI can do this now, where are we headed next?
Anyone else tried AI for video? Thoughts? 👀 #AI #VideoEditing #Tech
5:10 PM · Mar 28, 2024


1.3k

Reply

Share
Read more on X

68%
Refreshing metrics...
See how Releasd could work for your team
Explore the platform and create a free, branded report.