Custom Measurement
Analytics can be scaled up and down for any audience.
Custom metrics and charts enable PR teams to measure what matters to them.
You're in control
PR teams can choose what to include in any given report - from core PR metrics to advanced AI analytics.
Select from a vast array of data types, visualised in a variety of compelling metrics, charts and graphs.





Segment and compare analytics
Compare specific sections or coverage types within the same report.
Measure different tiers, regions or campaigns side-by-side; ideal for benchmarking, or to show progress over time.





Include custom metrics
It's common for PR teams to have bespoke measurement requirements.
Luckily, it's easy to add custom data to Releasd reports. Easily create visual infographics that bring any data to life - from coverage metrics to key activities.






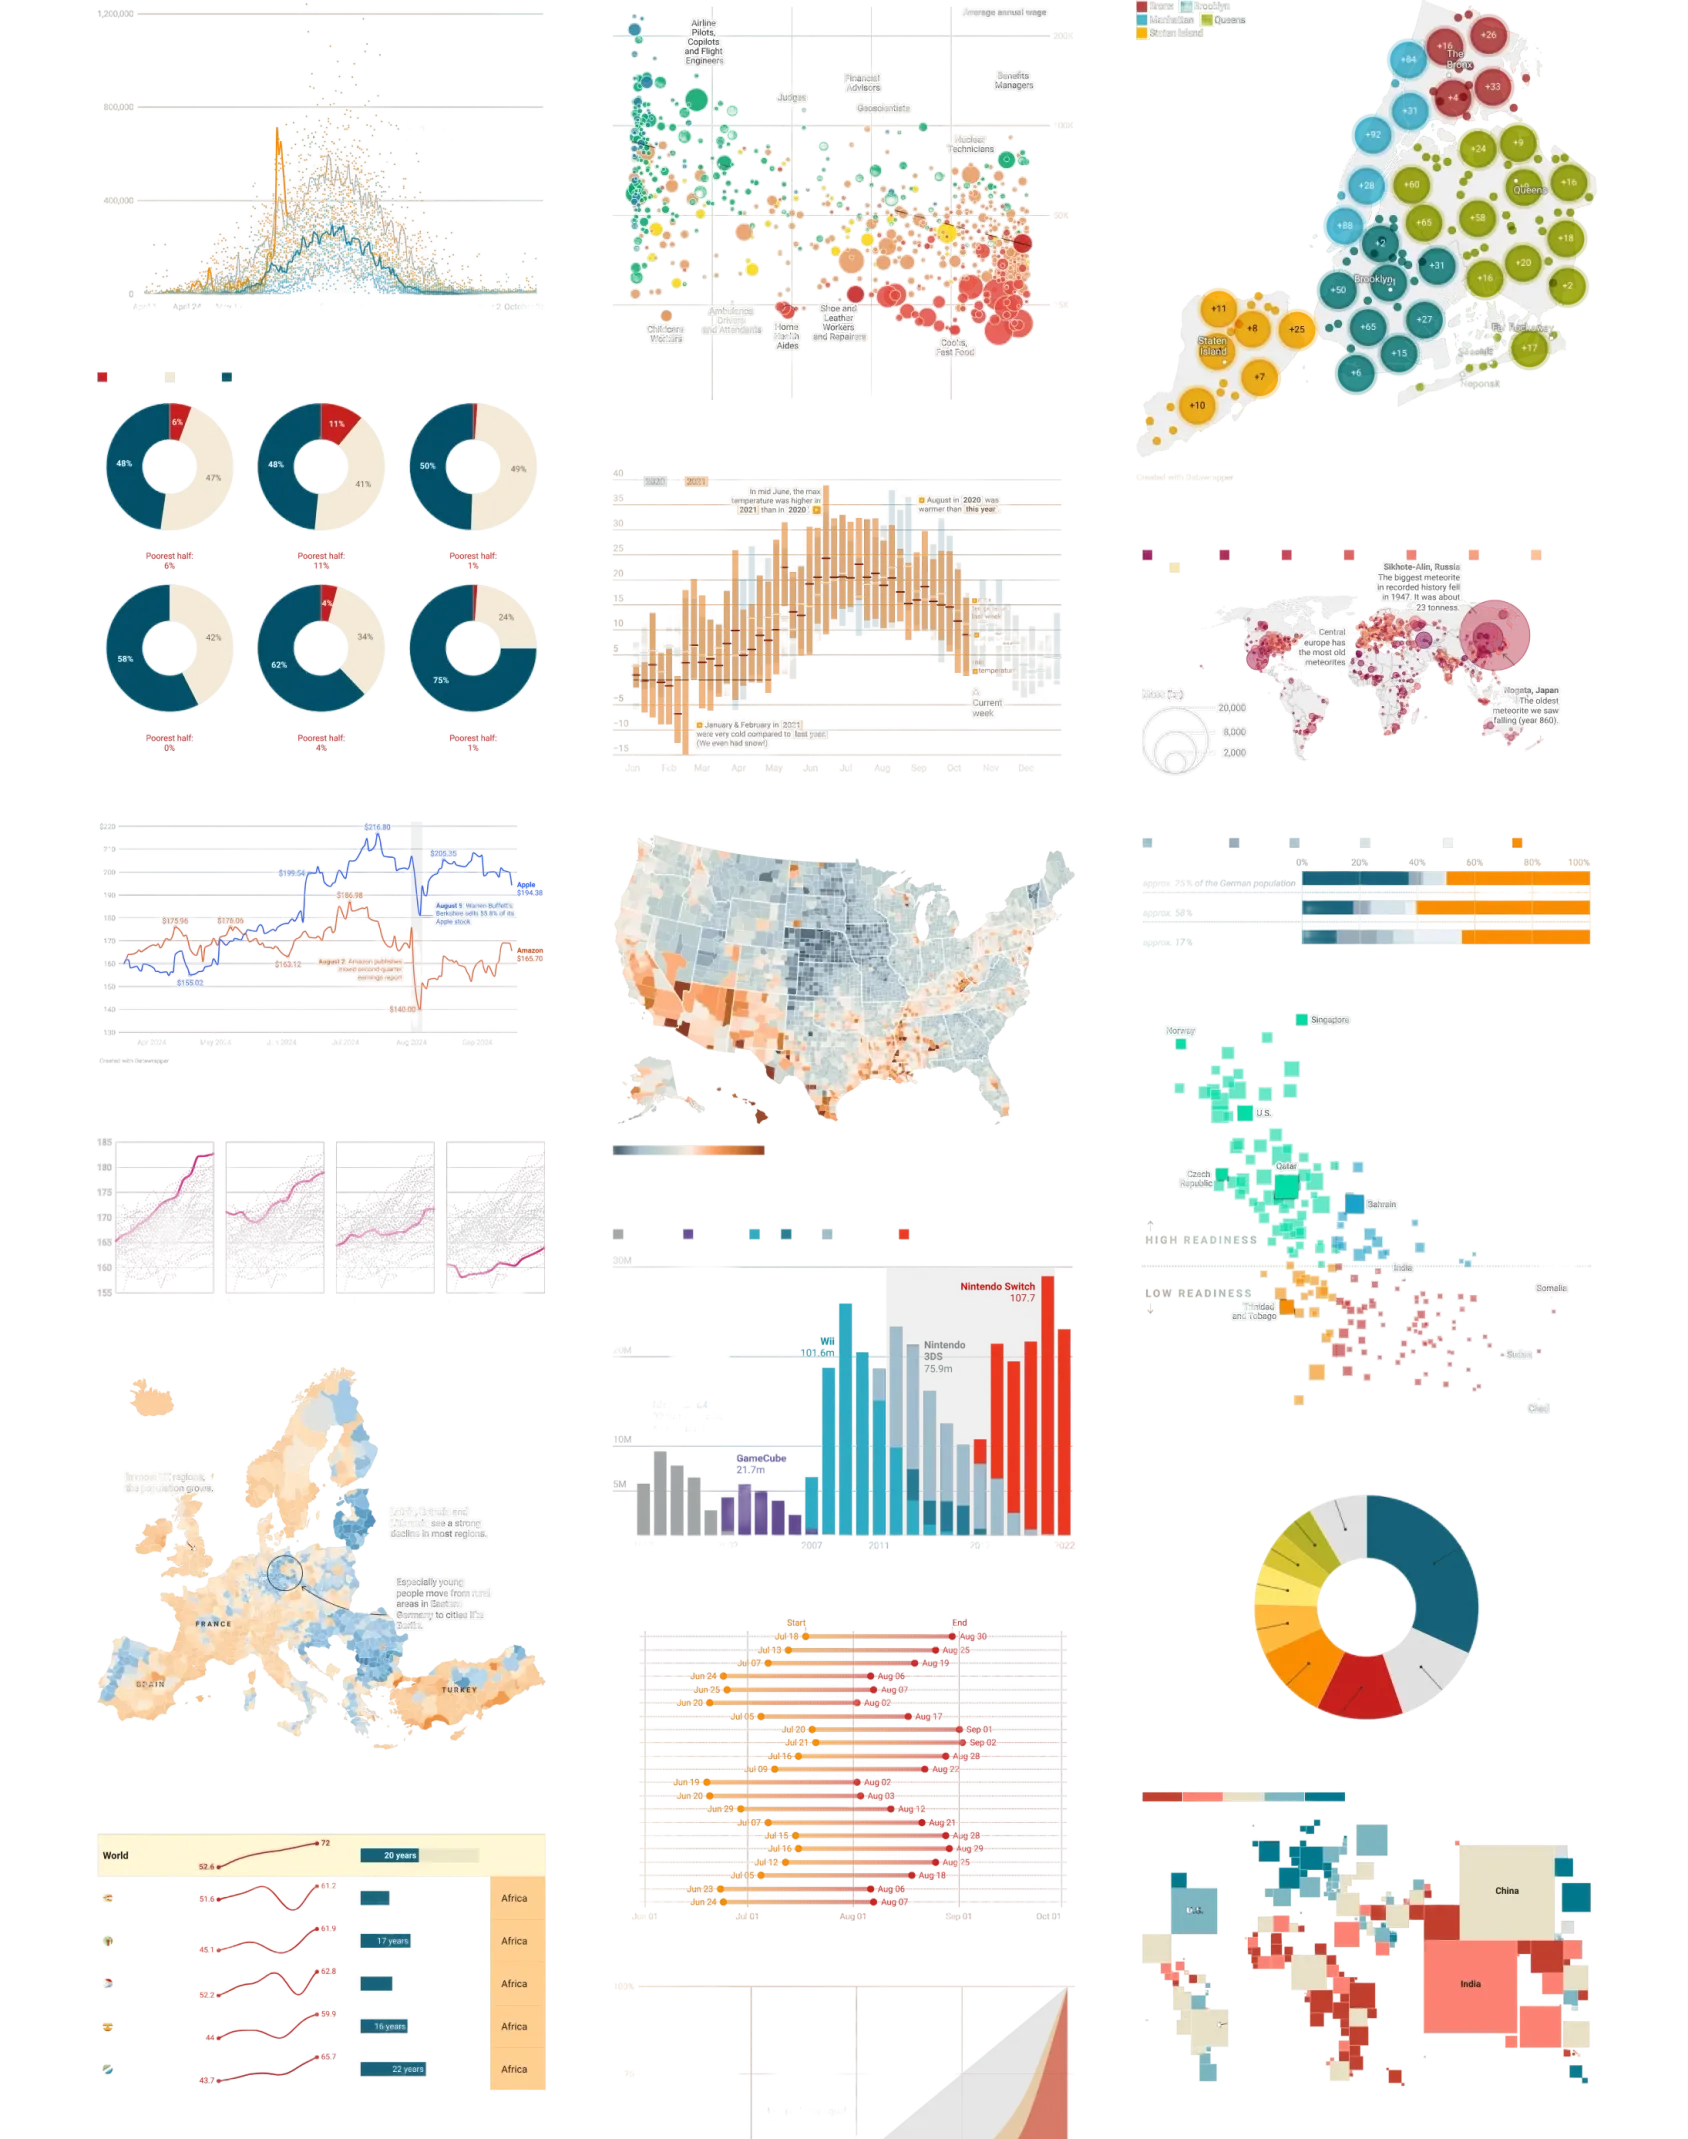
Embed charts & graphs
Easily create custom, interactive charts from services like Datawrapper and embed into a Releasd report.
Alternatively, add screenshots of third party data (for example graphs from any media monitoring platform) via the image gallery.

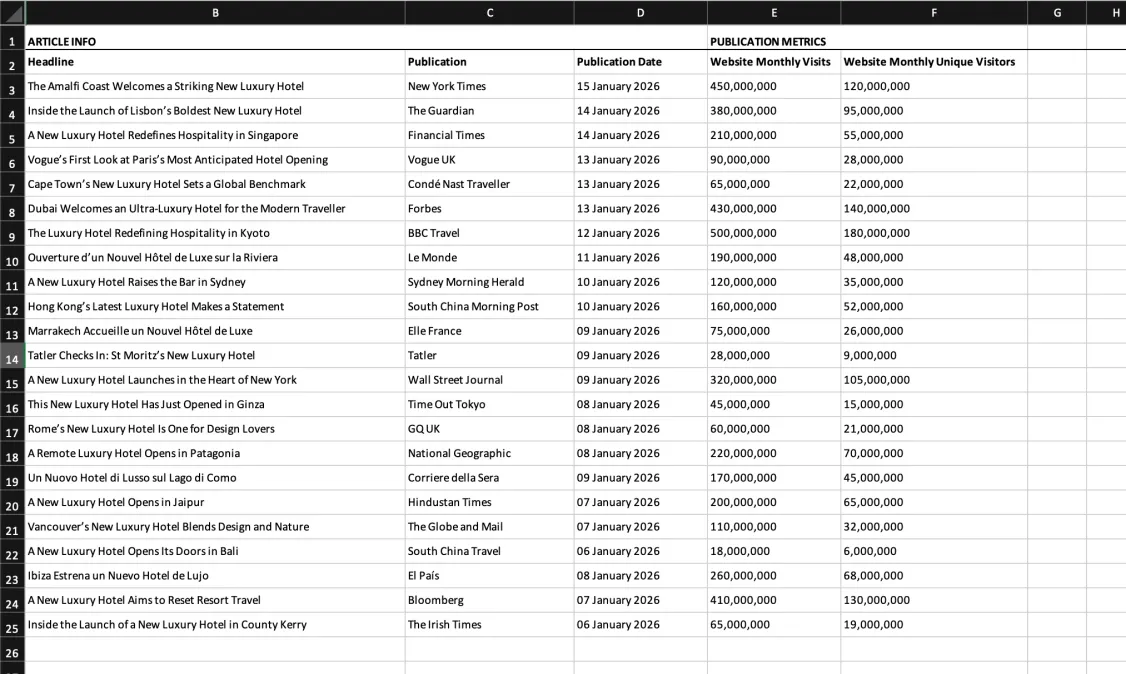
Export data to a spreadsheet
Need to crunch the numbers?
Get granular, line by line reporting for online, social, print or broadcast coverage in an exported spreadsheet.




See how Releasd could work for your team
Explore the platform and create a free, branded report.