PR measurement that proves real impact
Releasd makes it easy to demonstrate the real value of media coverage. With full control over measurement - from core KPIs to advanced AI-powered analytics - PR teams can have total confidence that they are proving genuine ROI.
You're in control
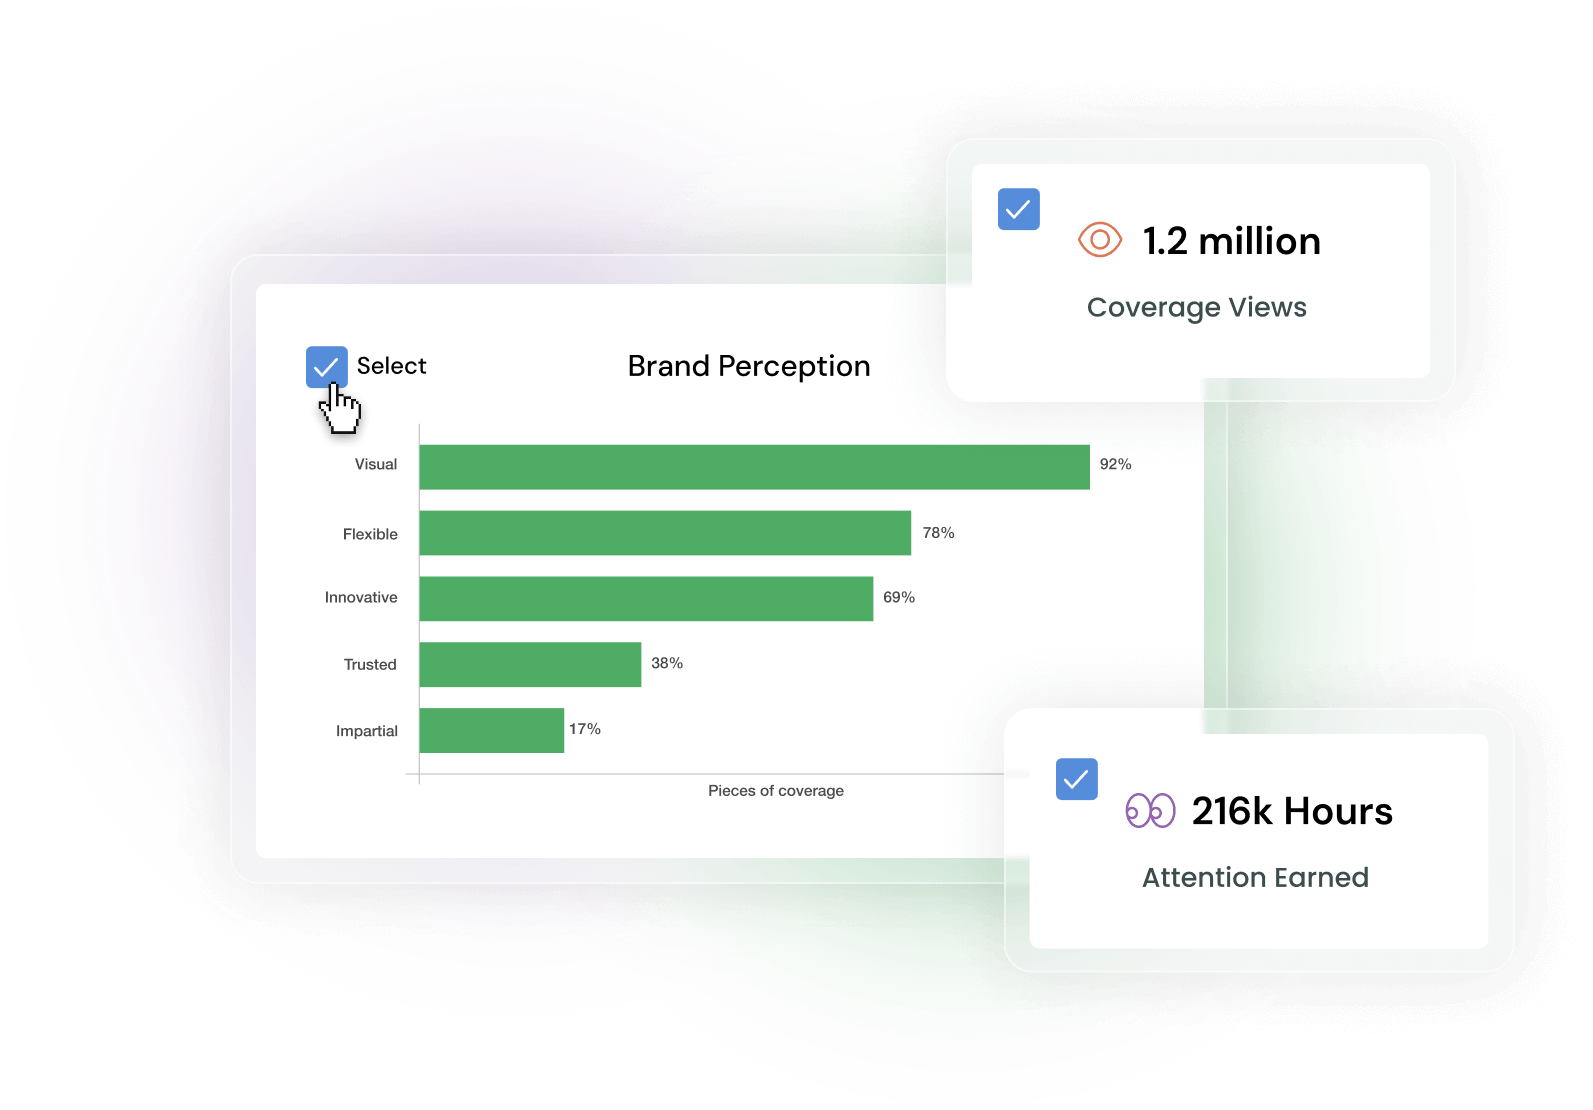
PR teams can choose which metrics or charts are included in each report and where they are placed, making it easy to scale up and down as appropriate.
Segment and compare analytics

Compare specific sections or coverage types within the same report, for instance different tiers, regions or campaigns side-by-side. Ideal for benchmarking, or to show progress over time.
Attention measurement
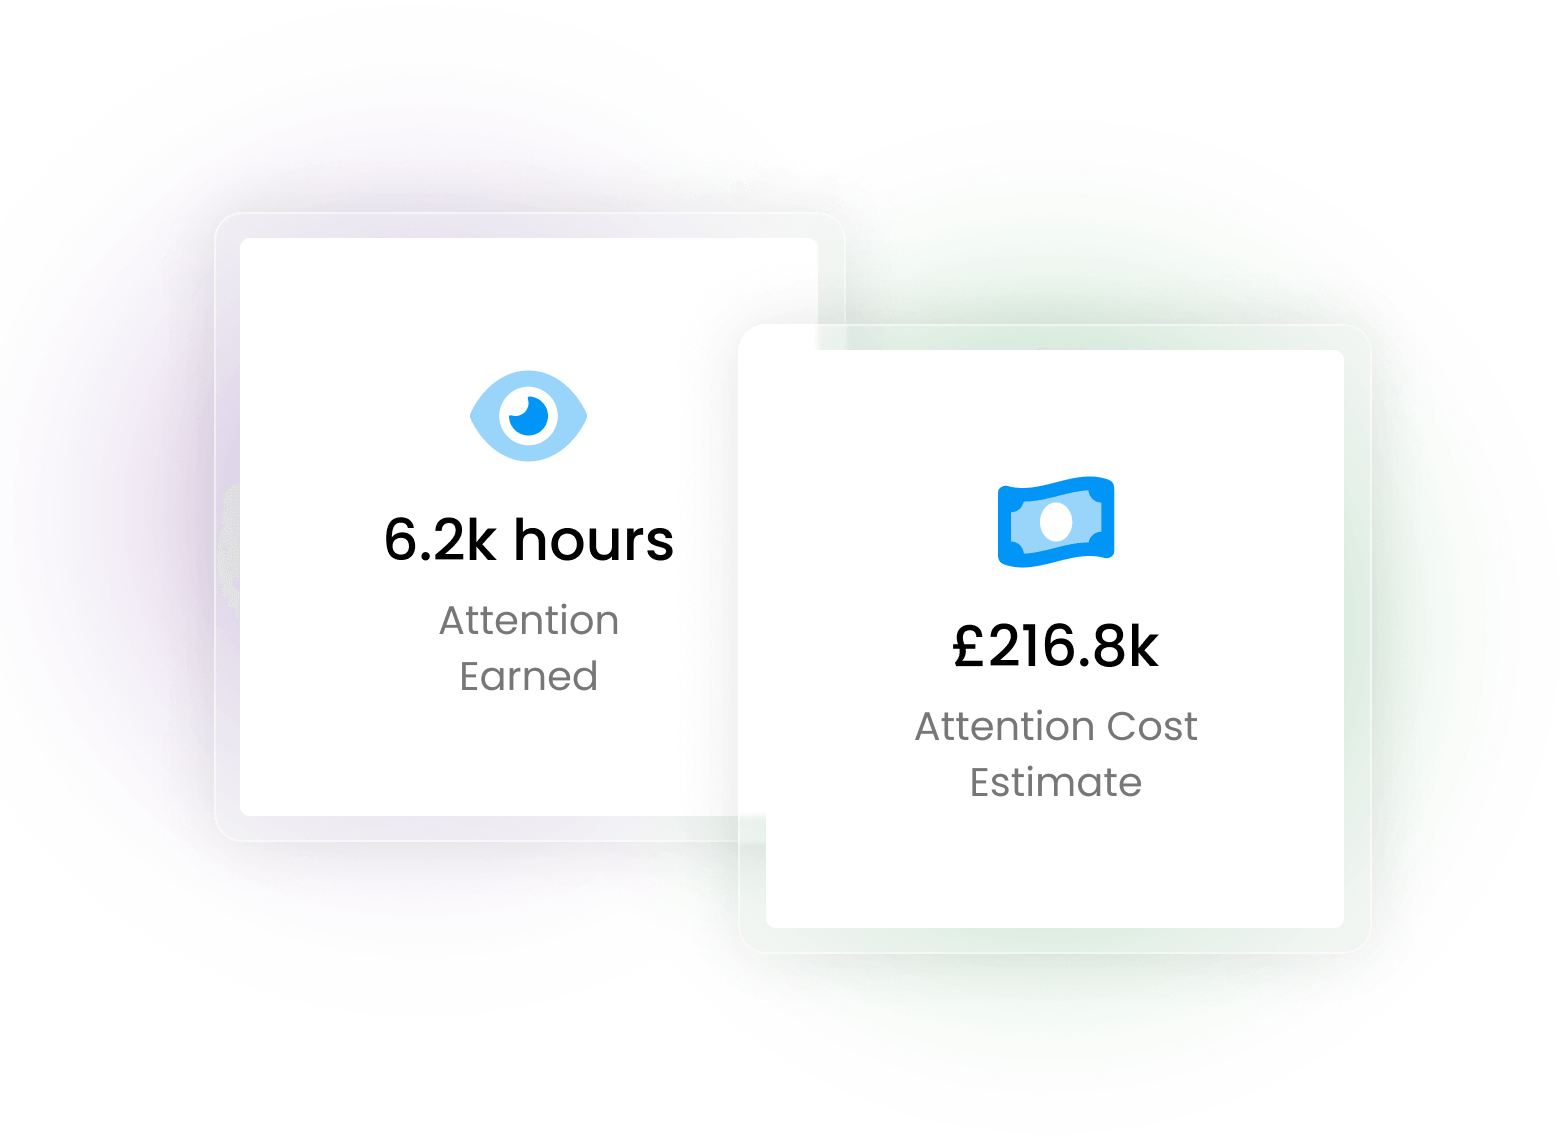
Our groundbreaking attention metrics - Attention Earned and Attention Cost Estimate - show how many hours of focused attention online coverage received, and the cost of purchasing that attention via digital ads (replacing AVE).
Accurate sentiment analysis
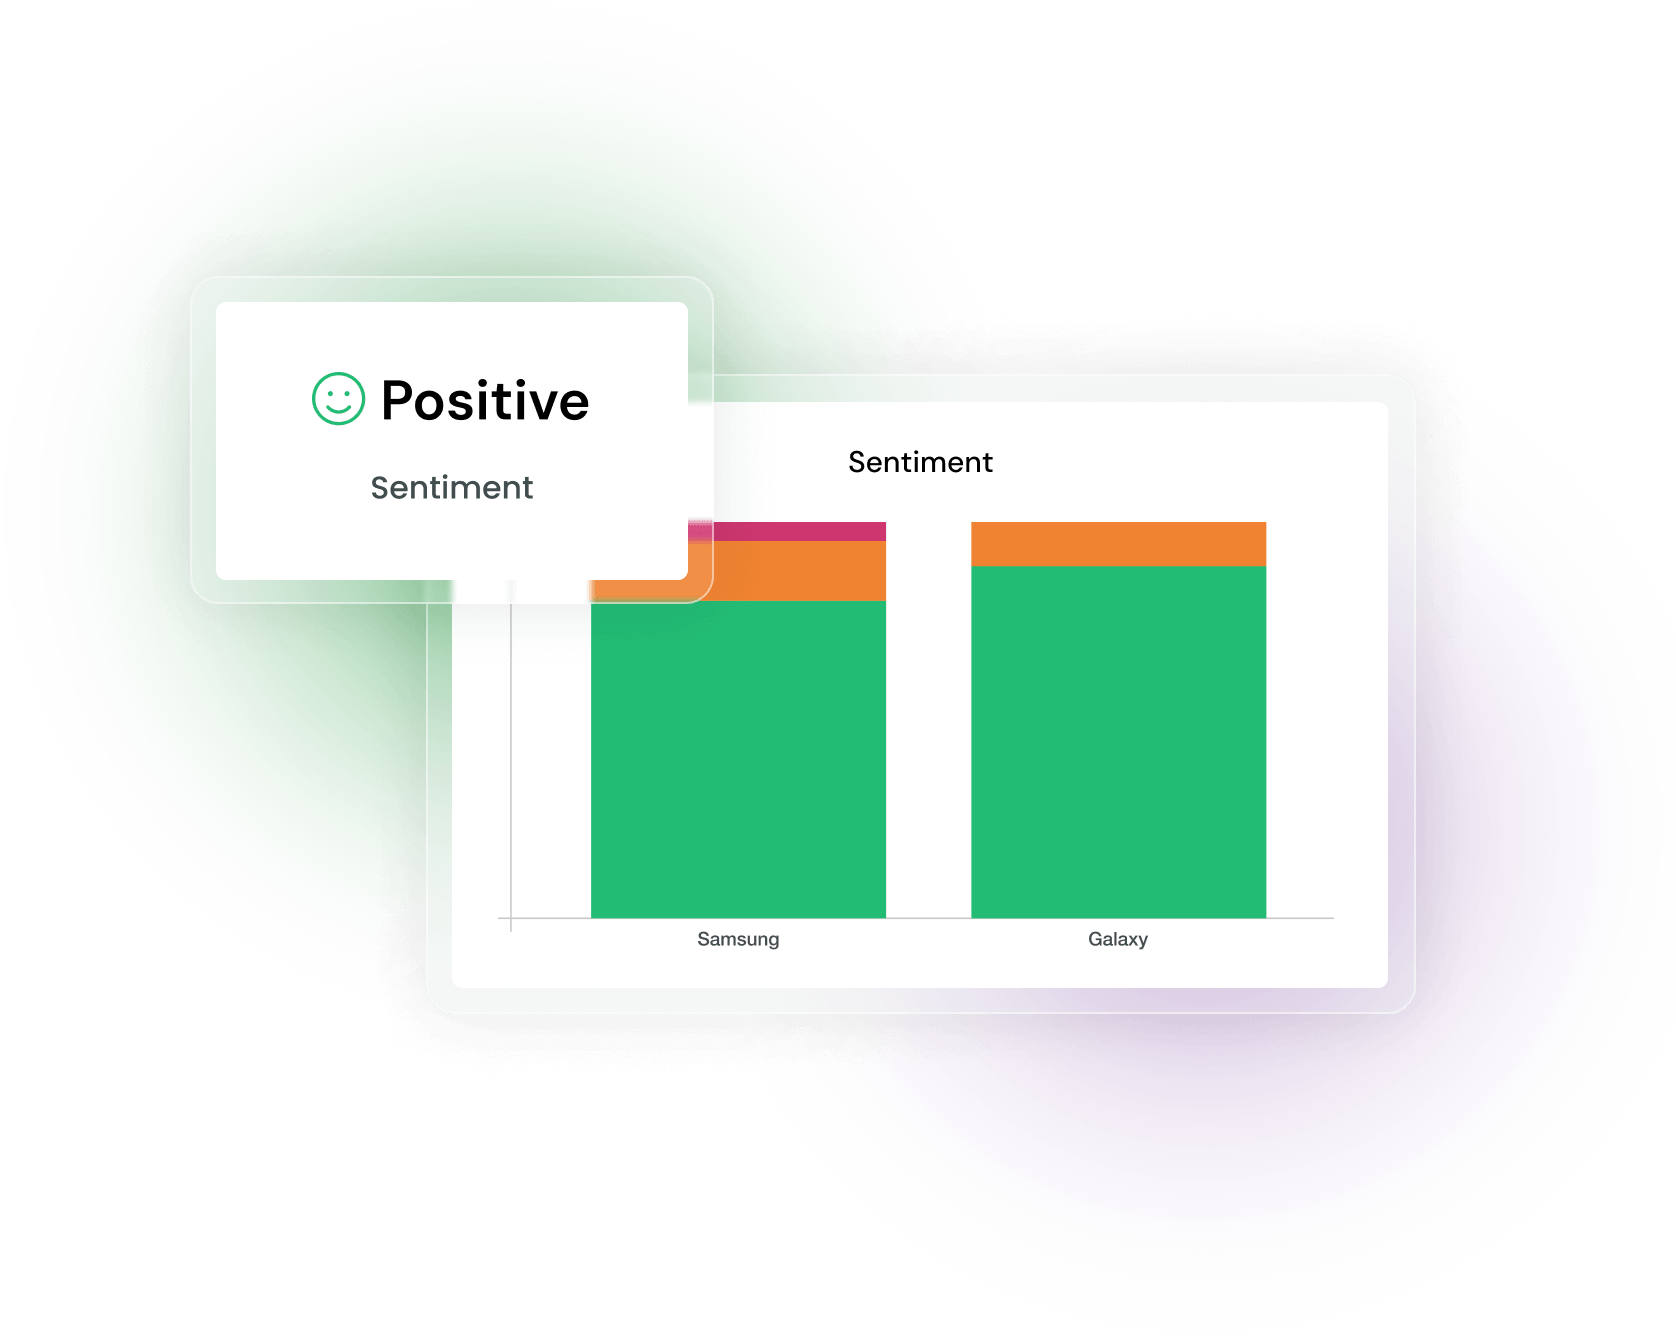
Measure the tone of online coverage around your Brand Keyword (e.g. company, event or product) rather than the article as a whole.
Mentions
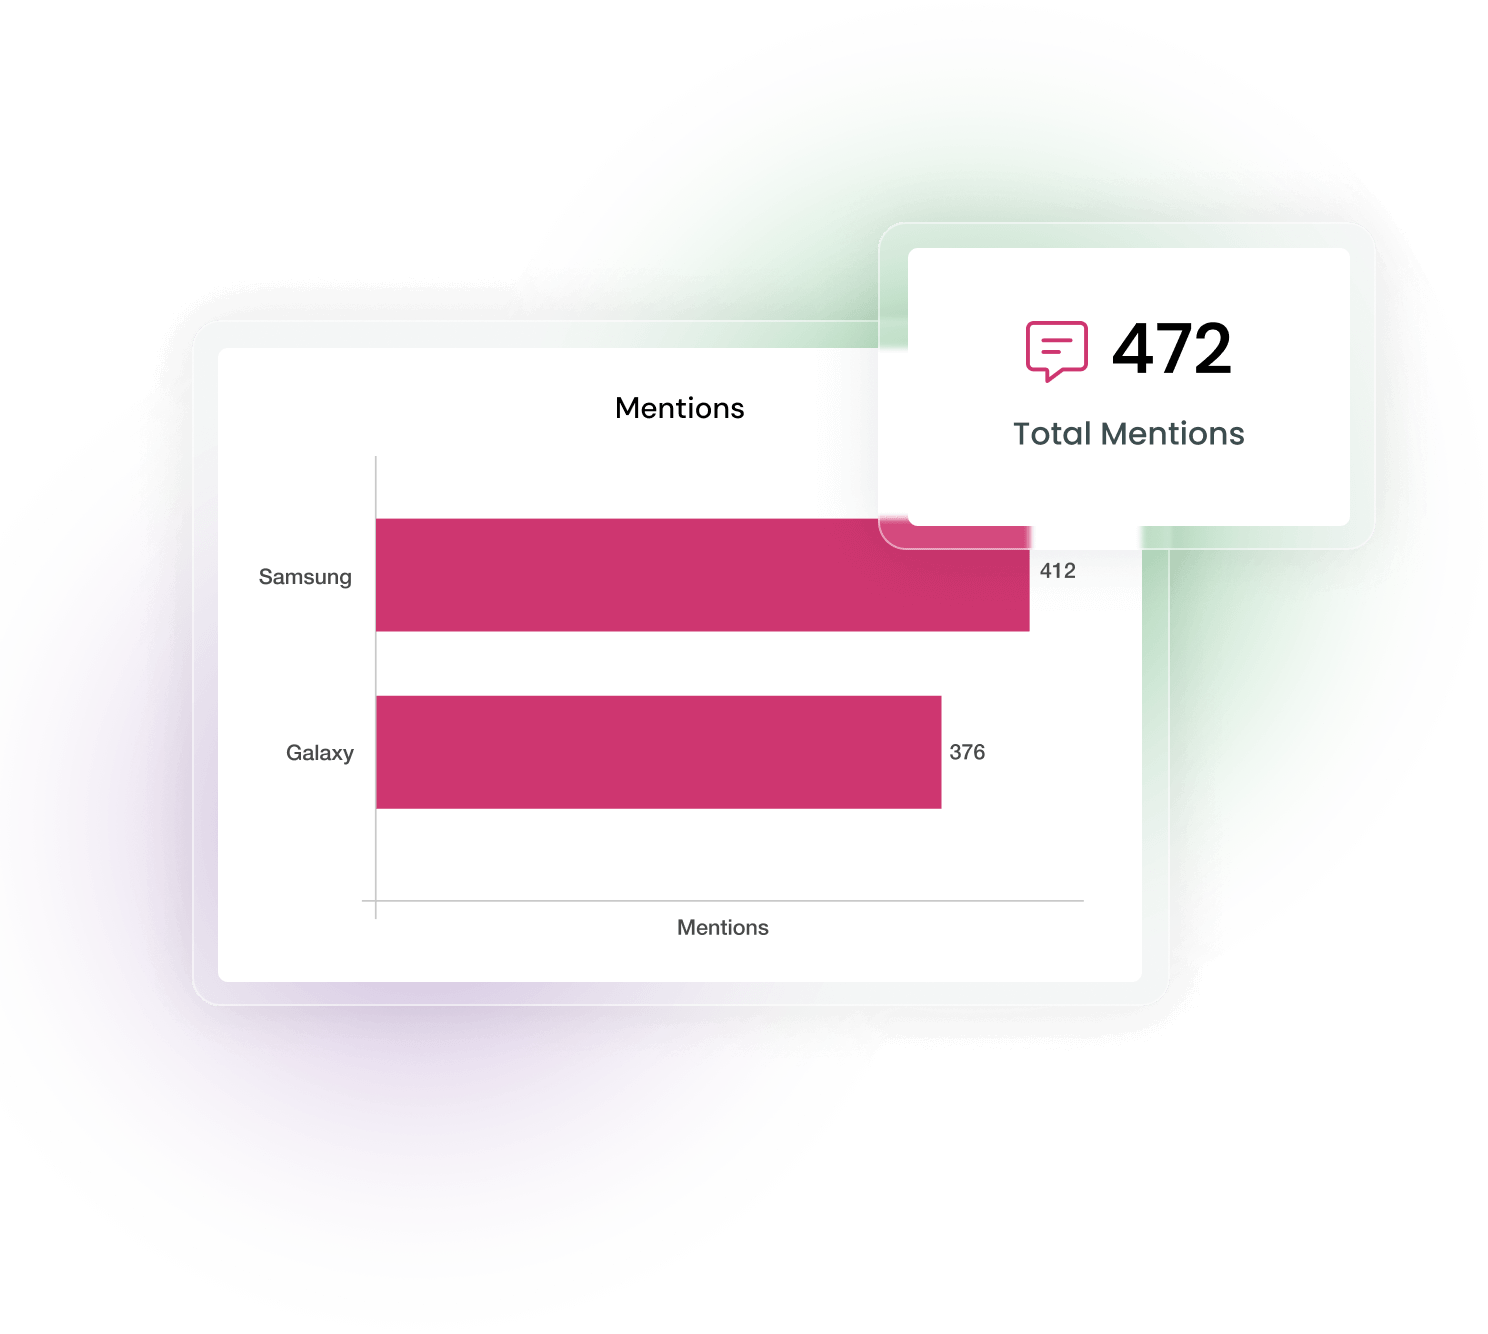
Based on the online coverage added to a report, show the number of times your Brand Keyword (e.g. company, event or product) is mentioned.
Prominence
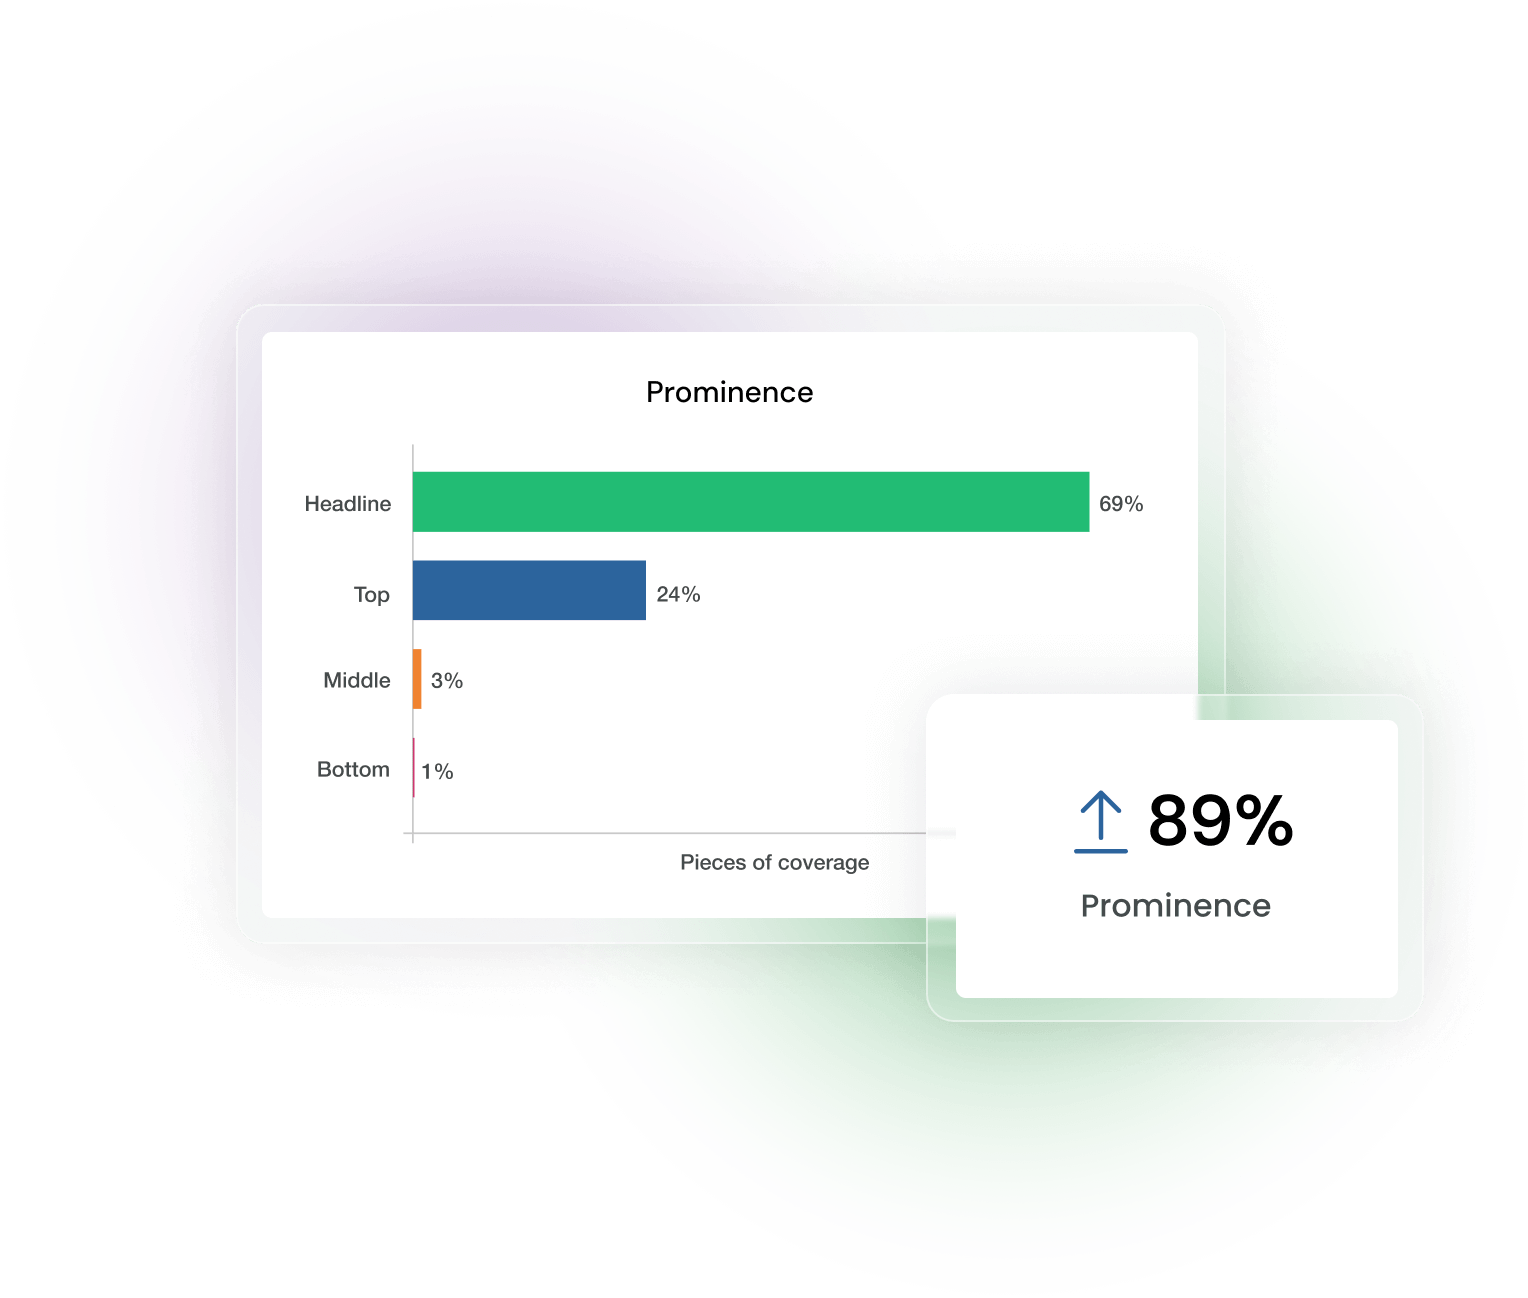
Show brand visibility by measuring whether your Brand Keyword (e.g. company, event or product) appeared in the headline, top middle or bottom of articles.
Key Message Penetration
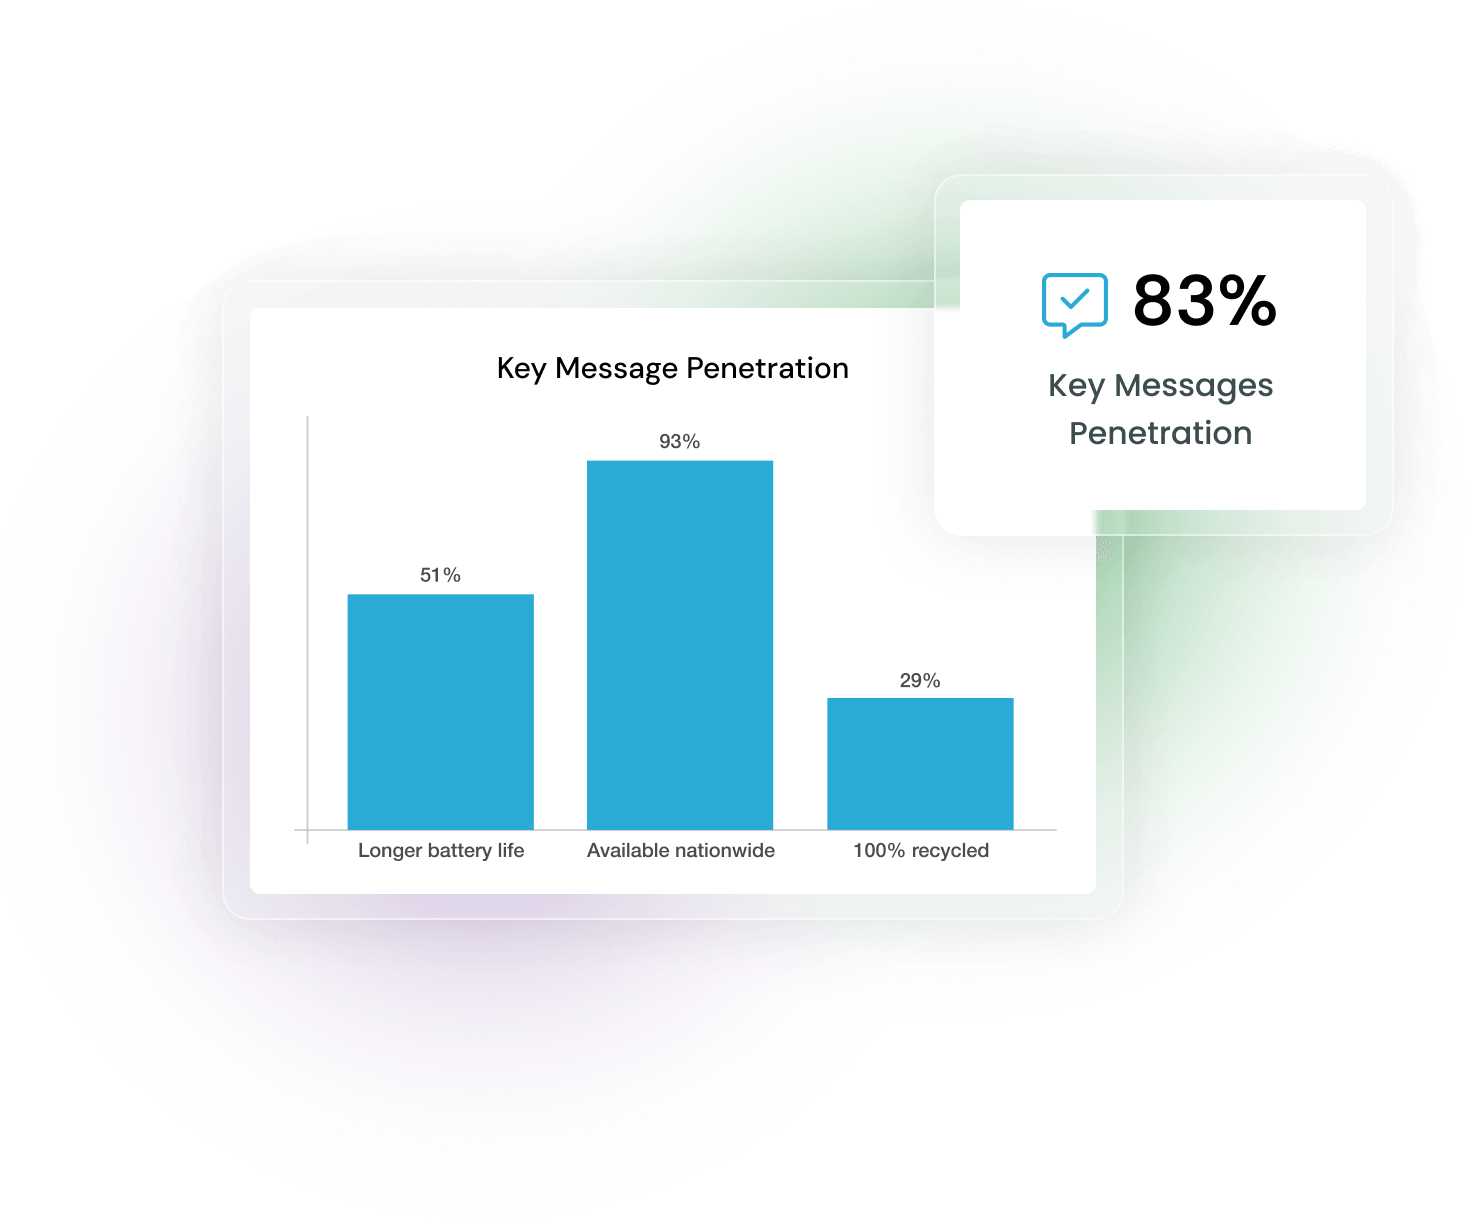
Demonstrate that you have successfully communicated with your audience. Input key messages and the platform will accurately detect their presence across online coverage.
Spokesperson Quote Inclusion
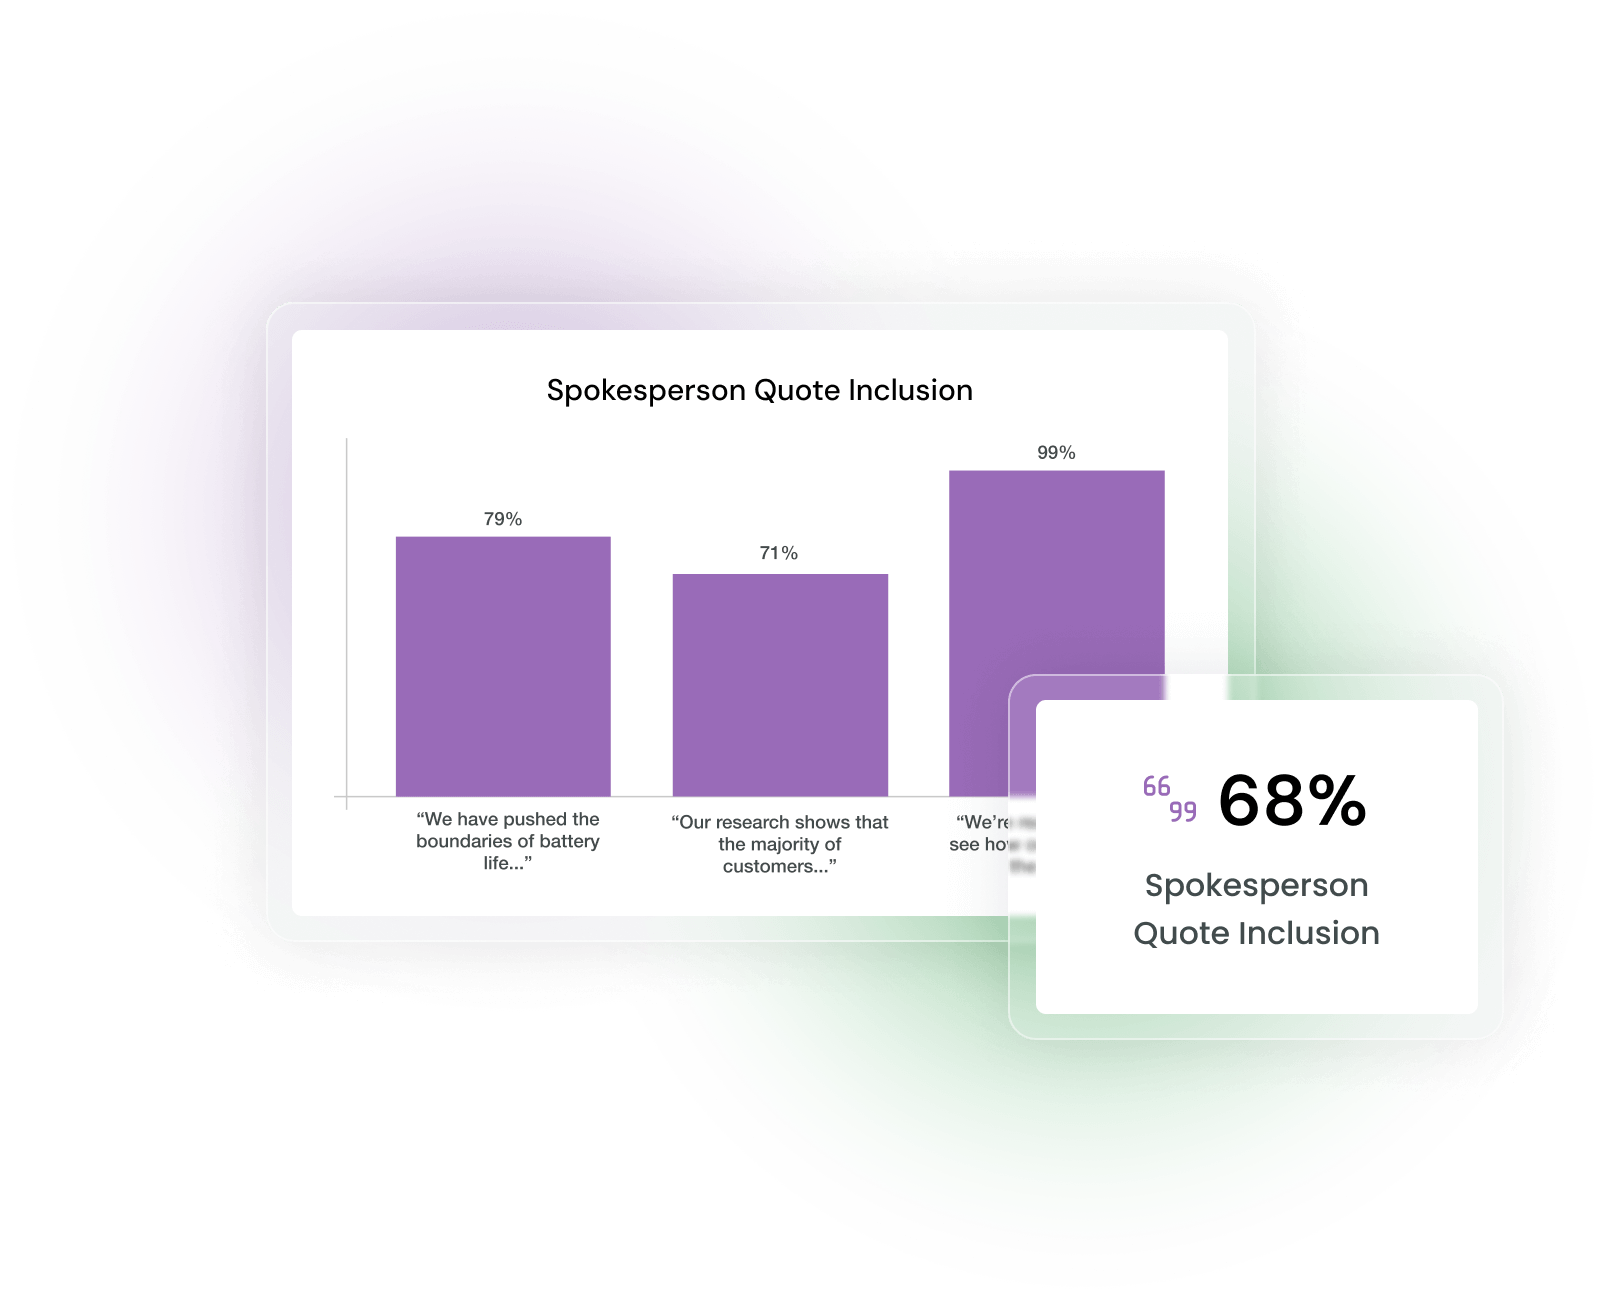
Input spokesperson quotes and the platform will accurately detect their presence within online coverage added to a report, adding further proof that key points have been communicated.
Perception analysis
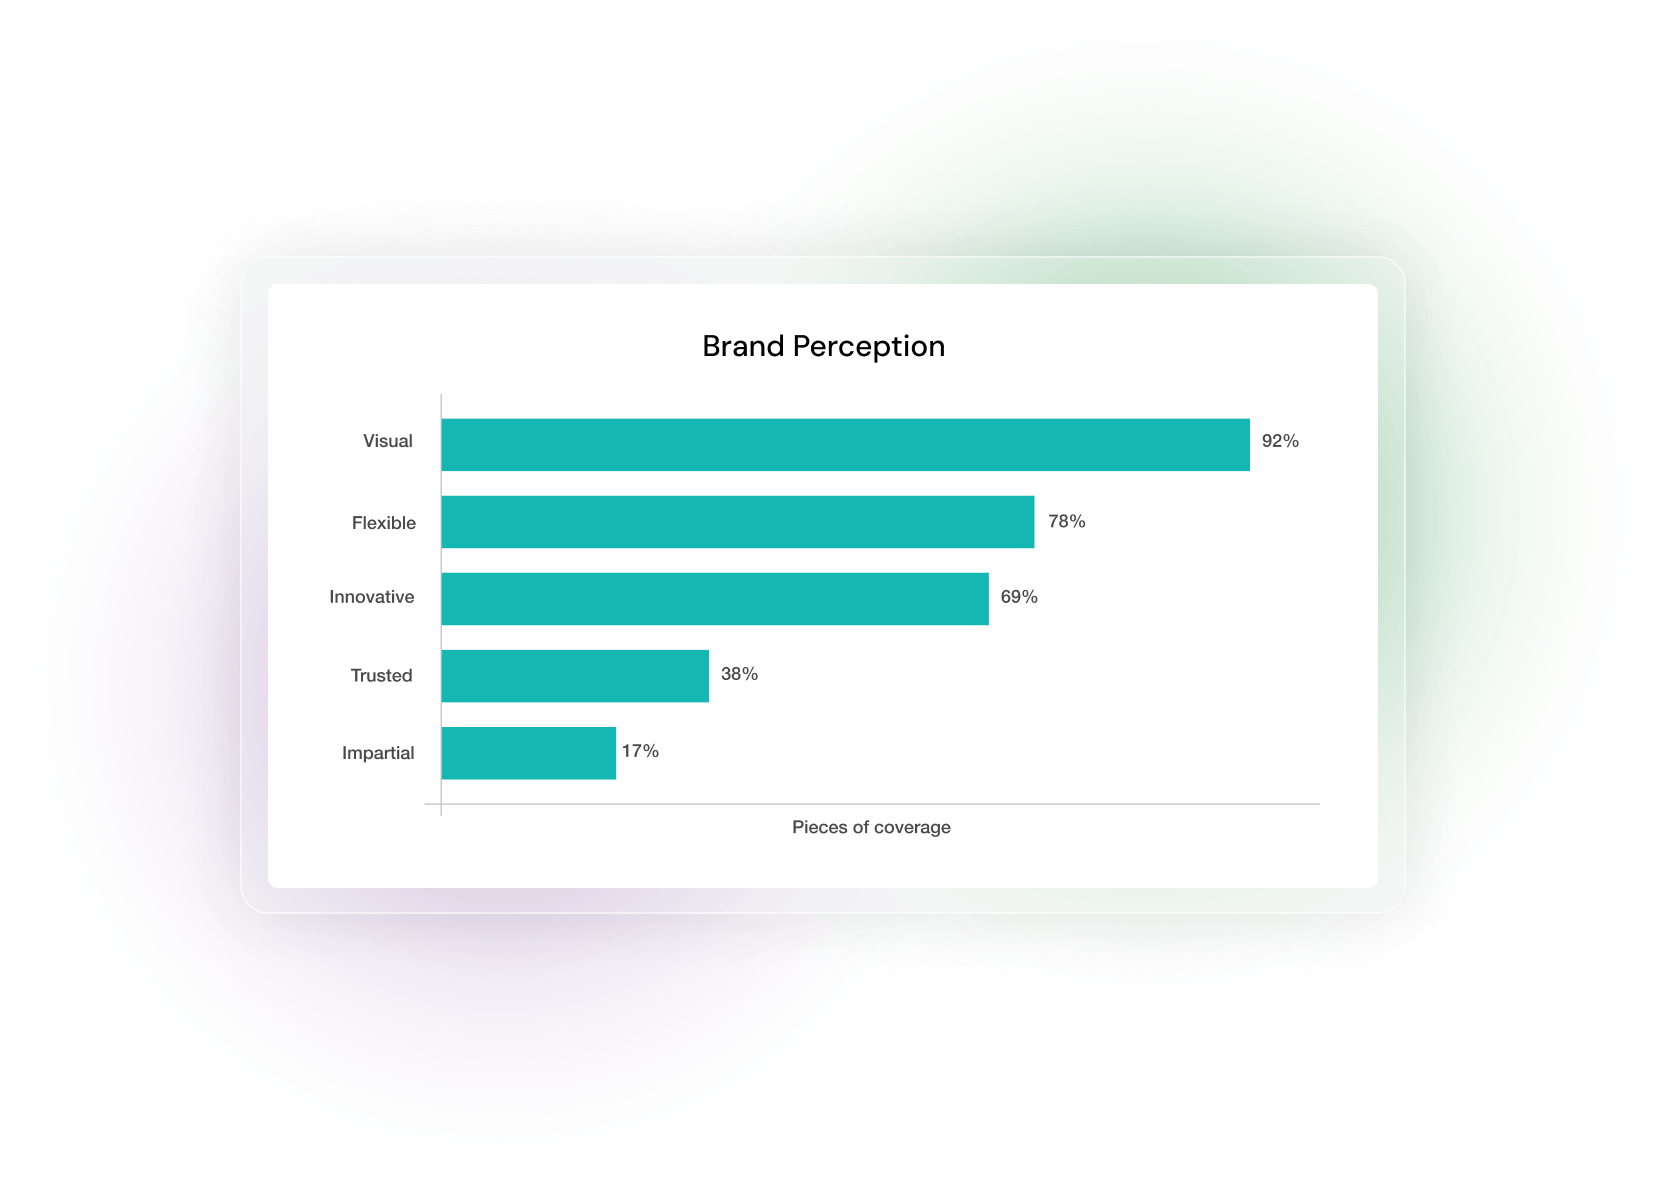
No need for expensive surveys or focus groups. Based on the online coverage added to a report, the platform will describe how the average reader would likely perceive your Brand Keyword (e.g. company, event or product).
Brand Recall Score
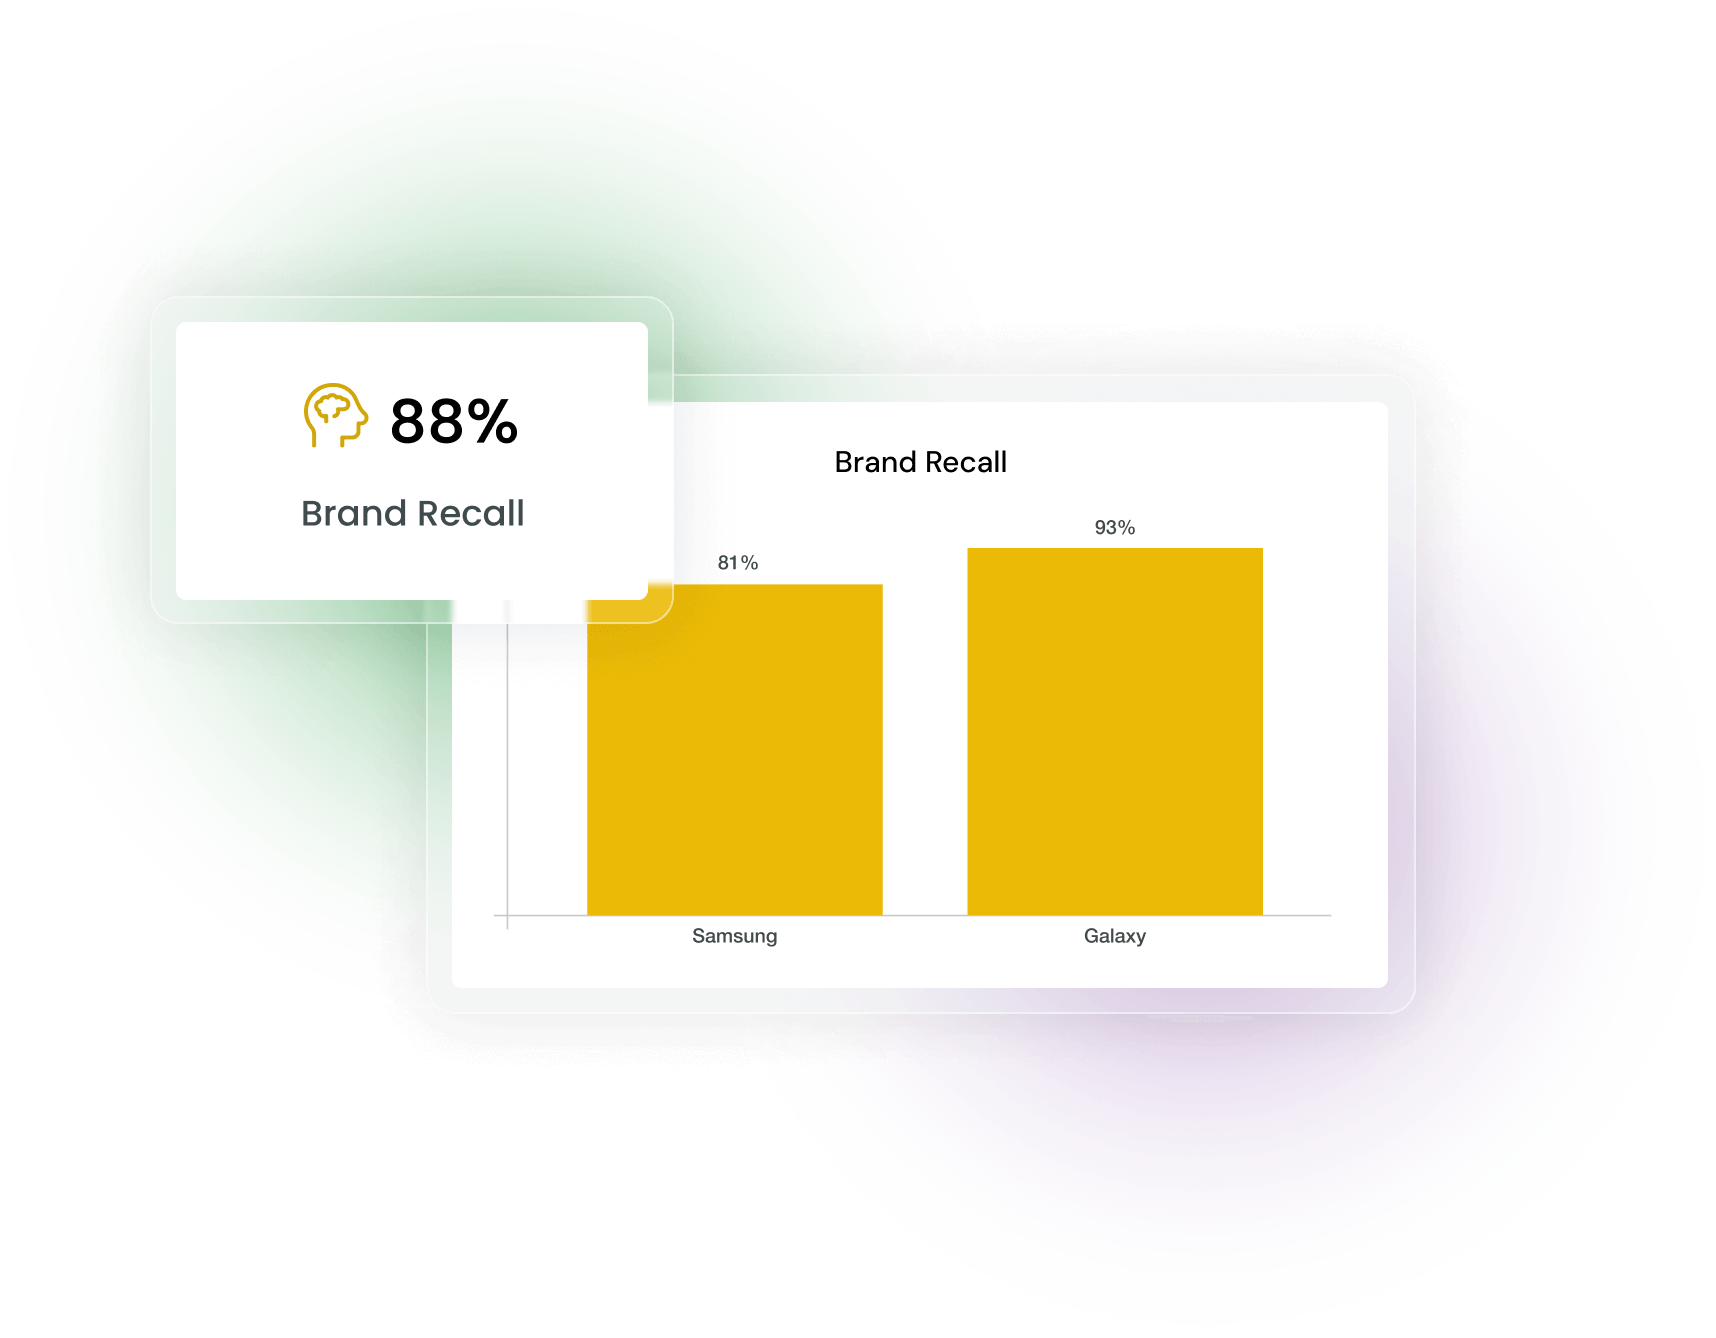
Demonstrate the lasting impact of PR. Based on the online coverage added to a report, the platform will rate the memorability of your Brand Keyword (e.g. company, event or product).
Backlinks
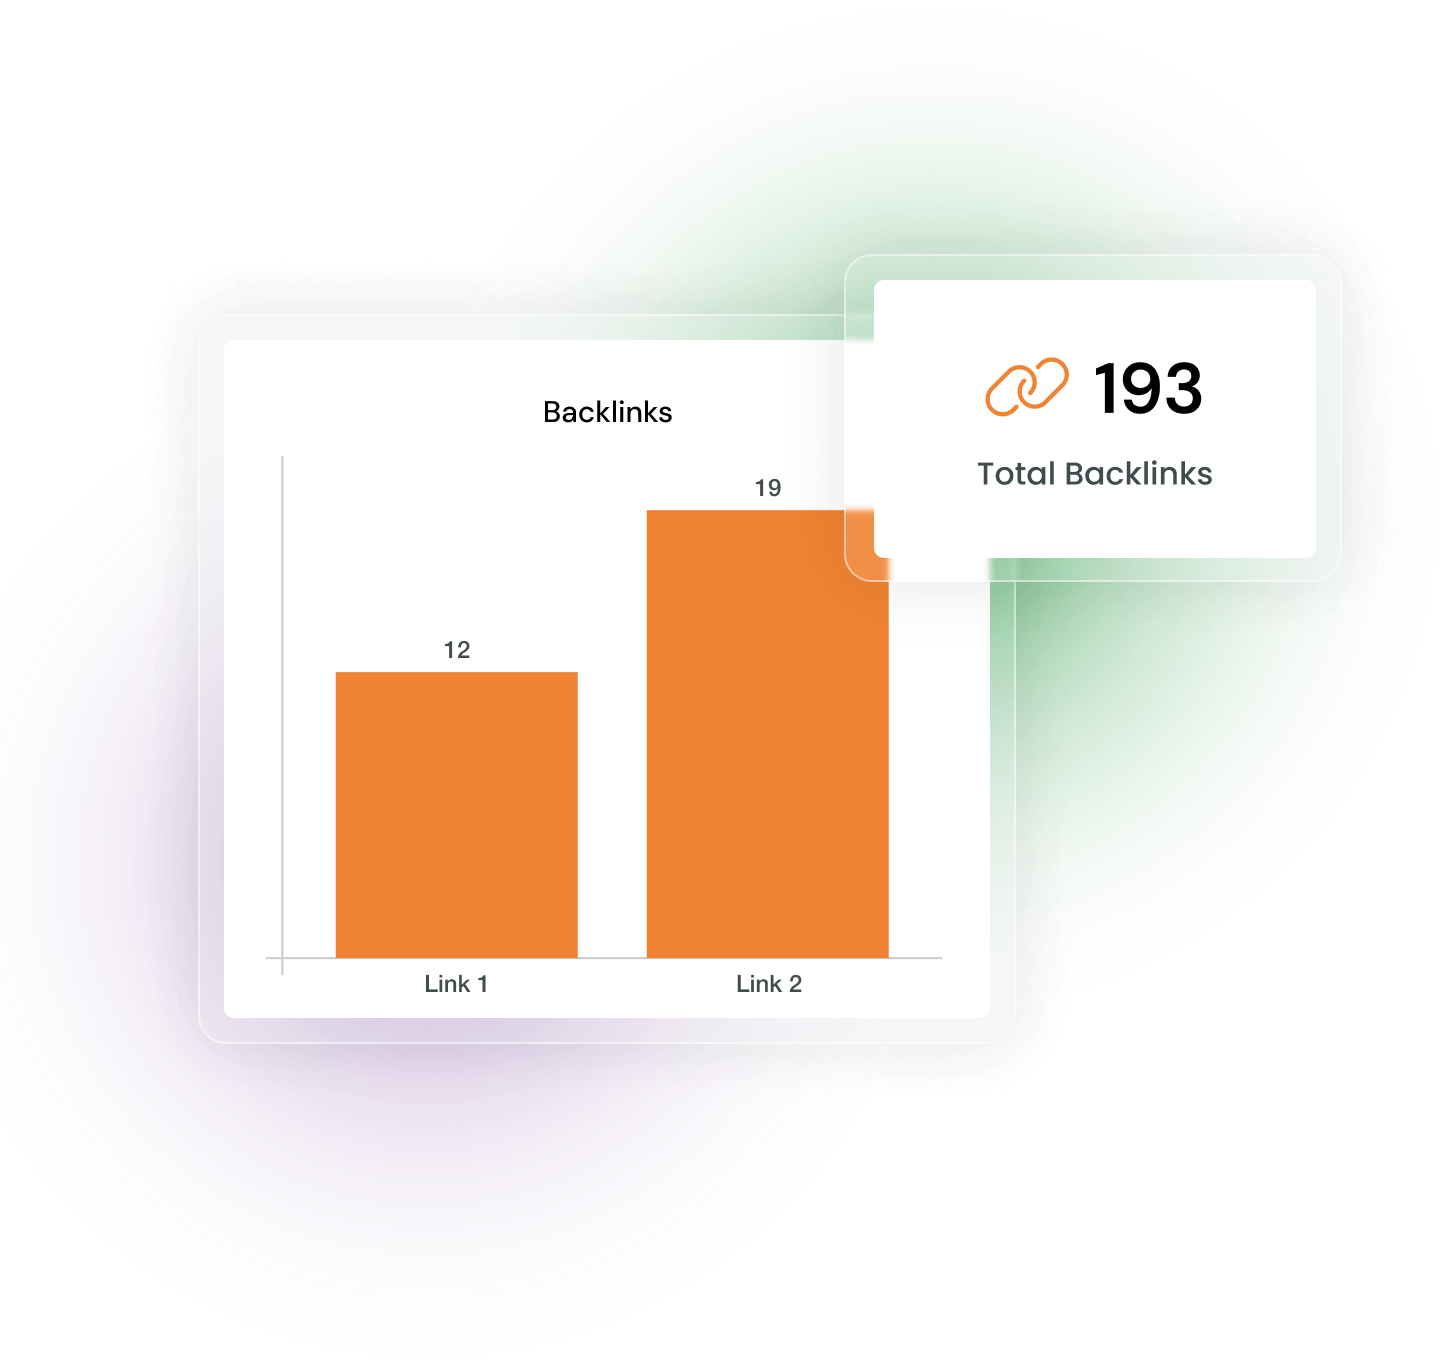
For SEO and lead generation purposes, see how many online articles include links back to your chosen domains (even if they go via affiliates or any third party sites).
Reach, UV & Coverage Views
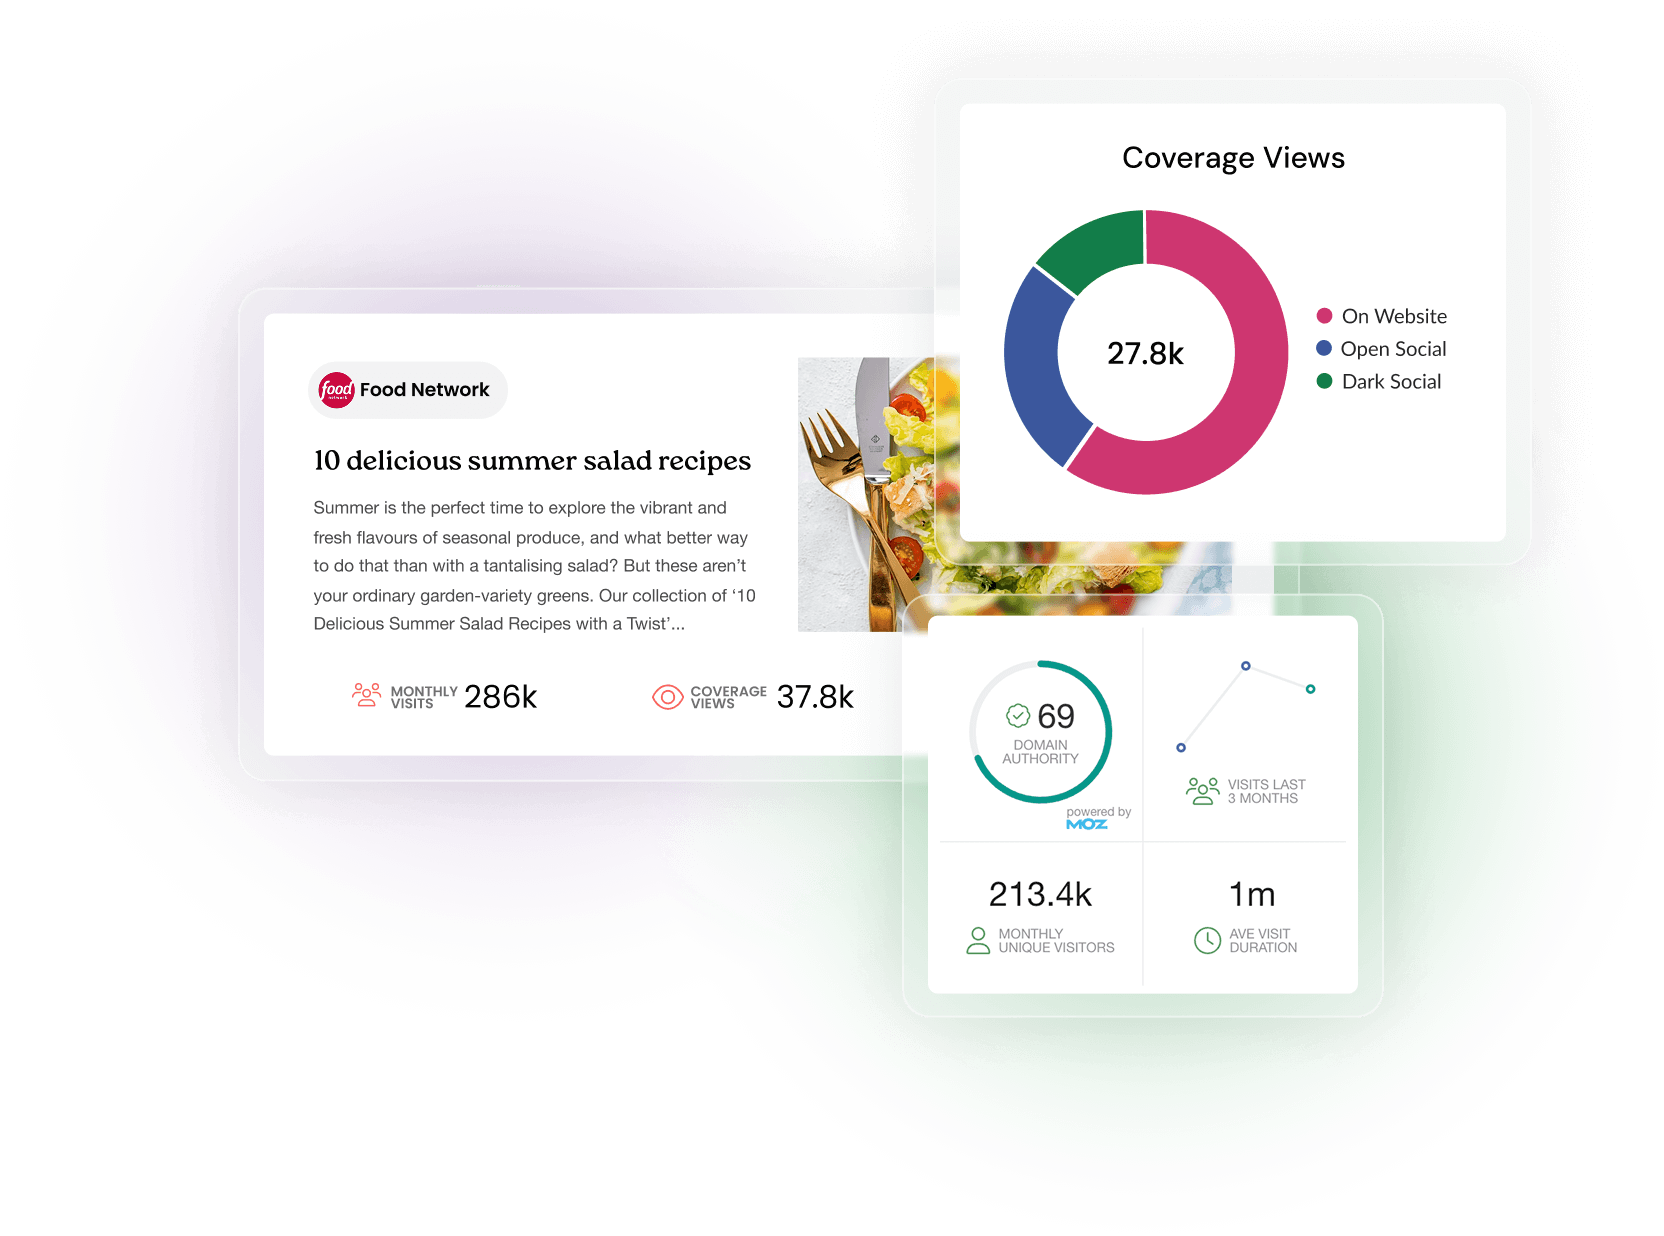
Releasd connects with SimilarWeb for best-in-class publication data, and uses a proprietary algorithm to calculate coverage-level views.
Domain Authority
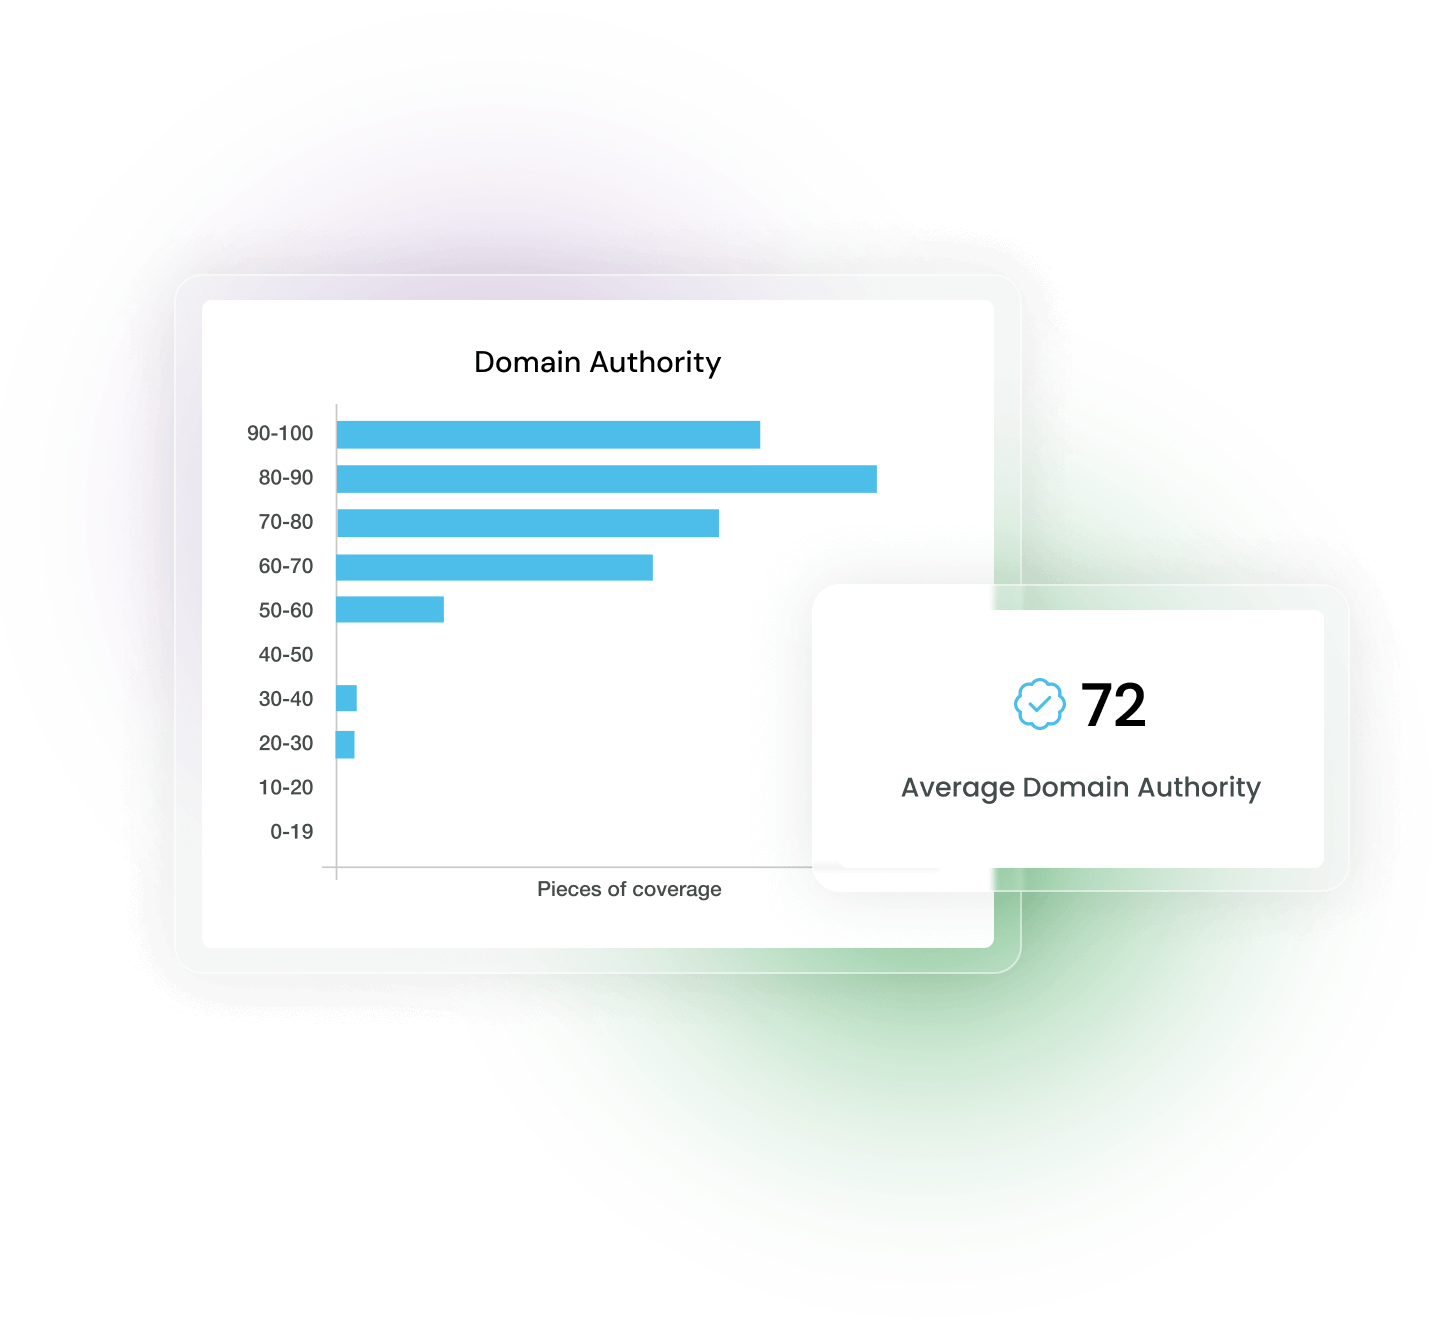
Releasd connects with MOZ for global Domain Authority data for articles. PR teams can also see an average and visualise DA across all publications.
Open / Dark Social shares & engagements
Data is sourced from all available social media platforms, enabling PR teams to see how online coverage is being shared and engaged with globally.
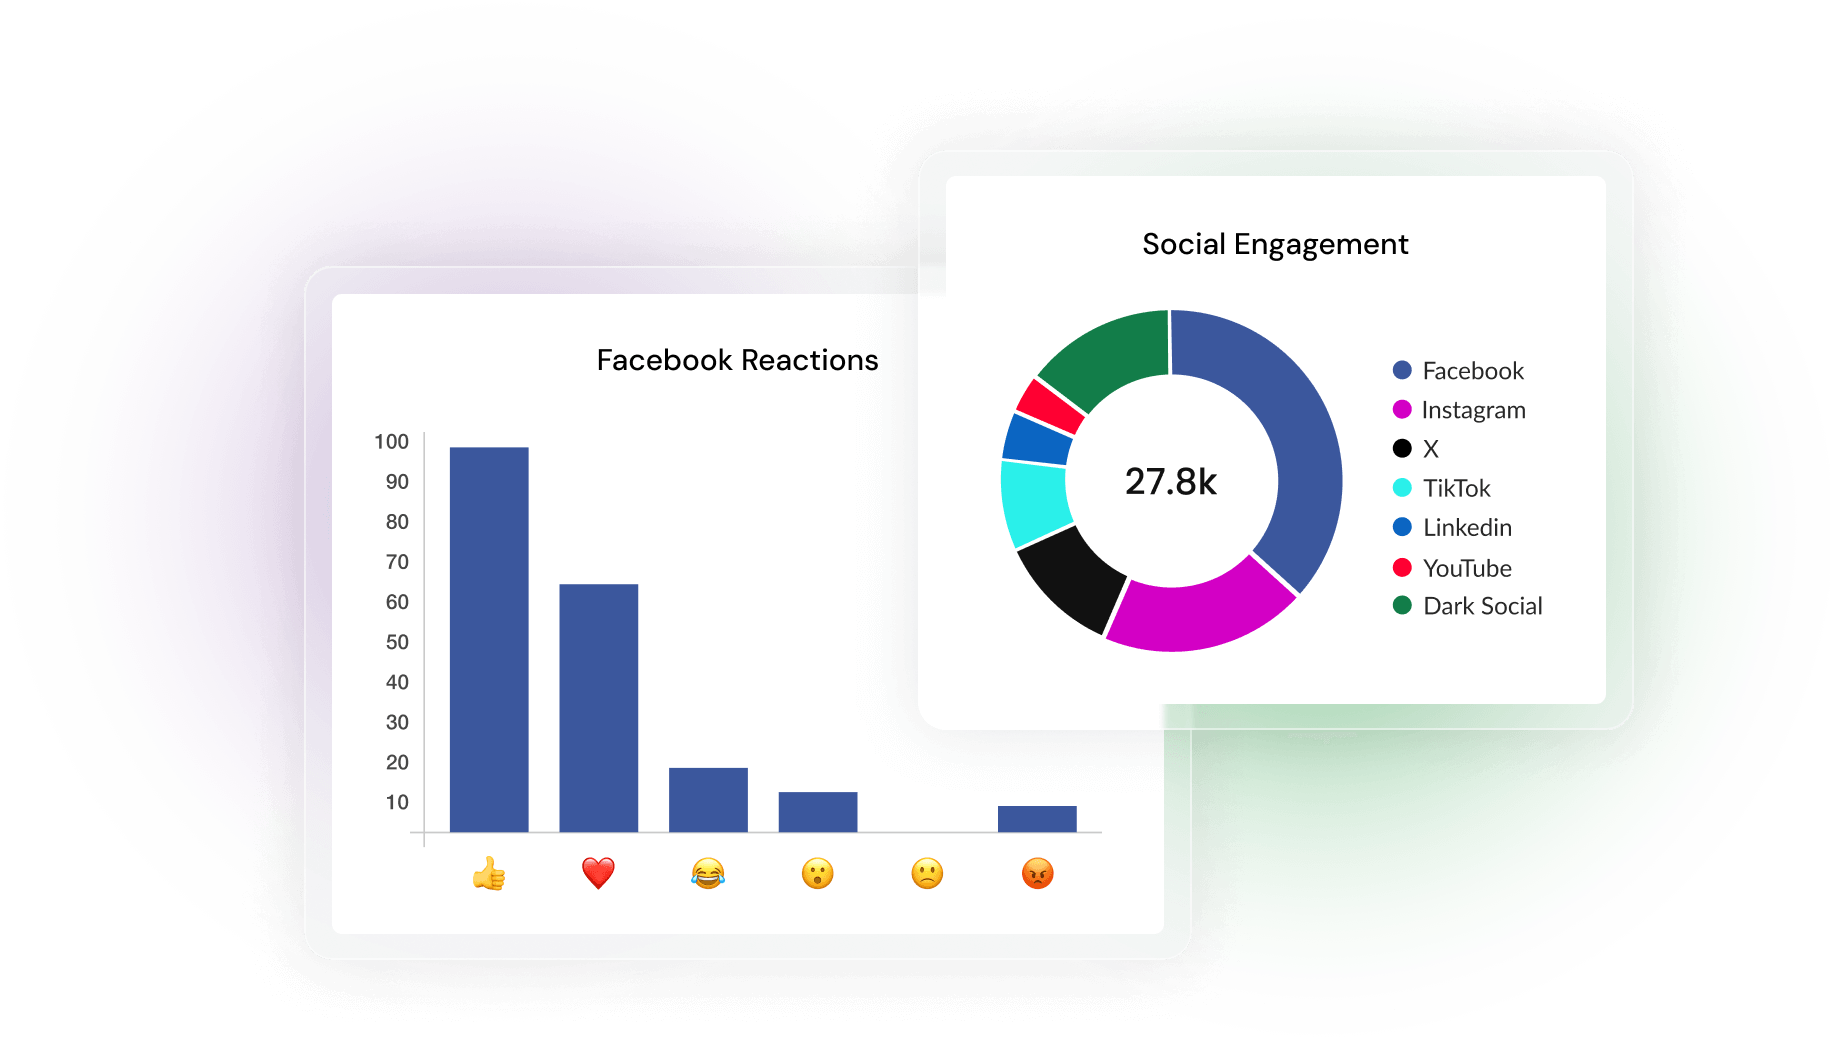
Automated social media analytics
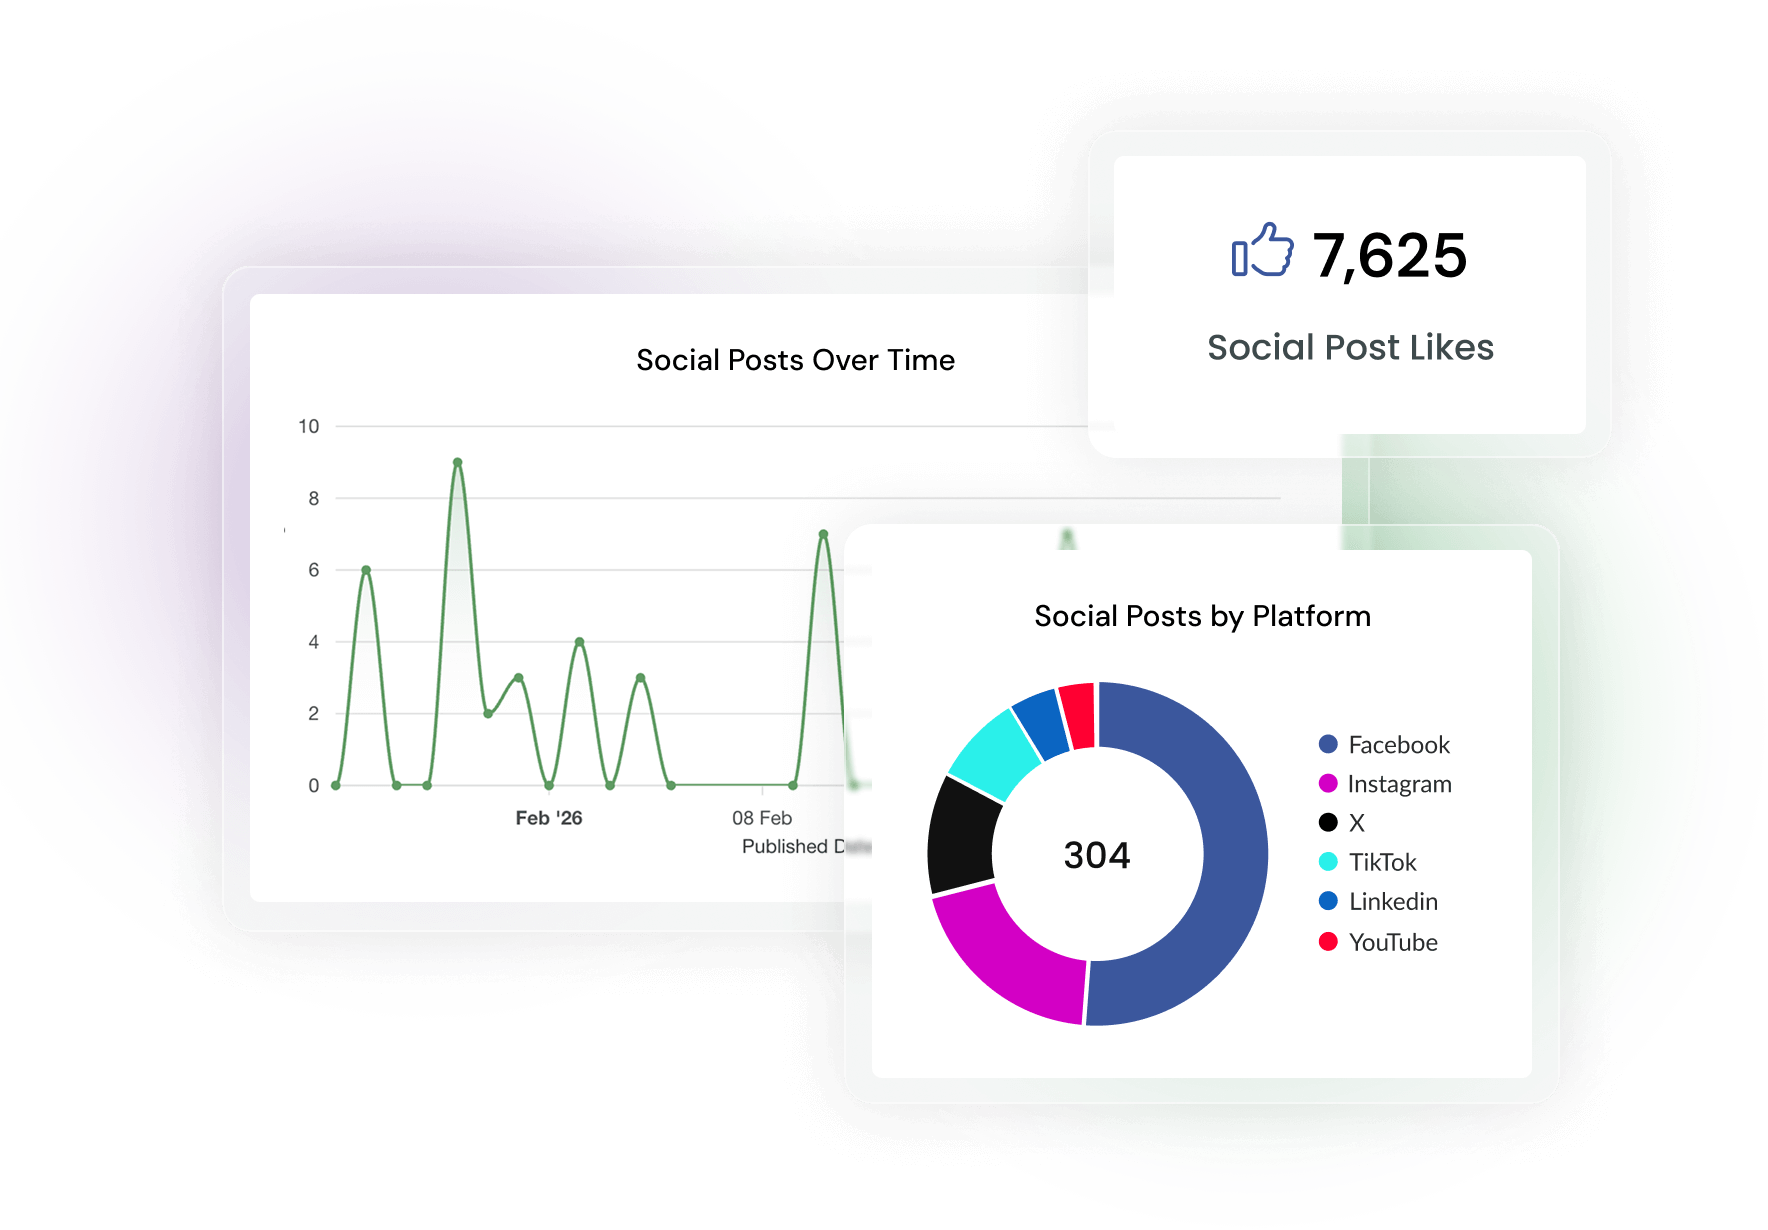
Add LinkedIn, YouTube, Instagram, TikTok, Facebook and X posts and the platform will provide granular post-level metrics and overall report analytics.
Add print & broadcast metrics
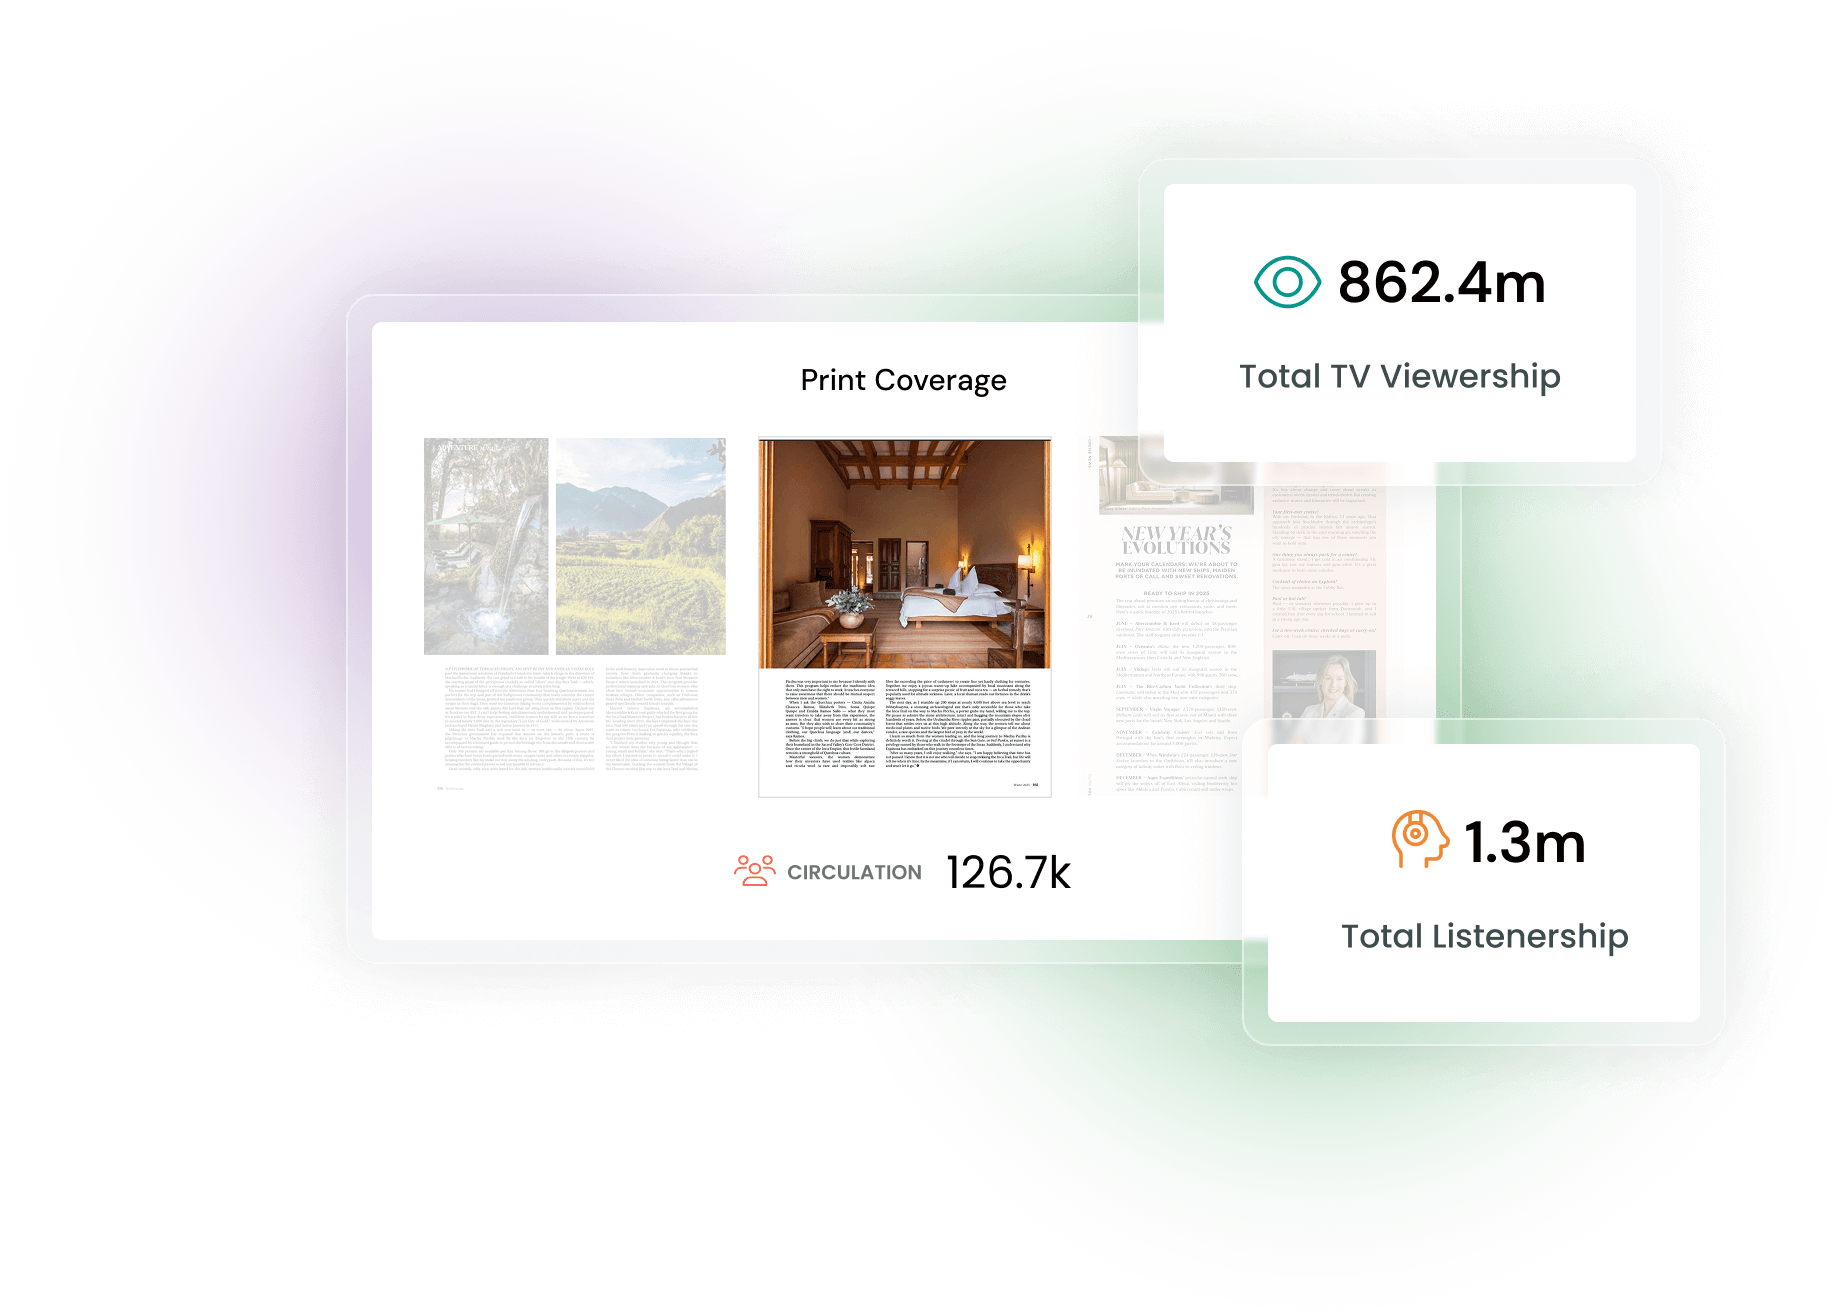
Input figures for print, audio and TV coverage and the system will save them and automatically total them up.
Automated coverage totals
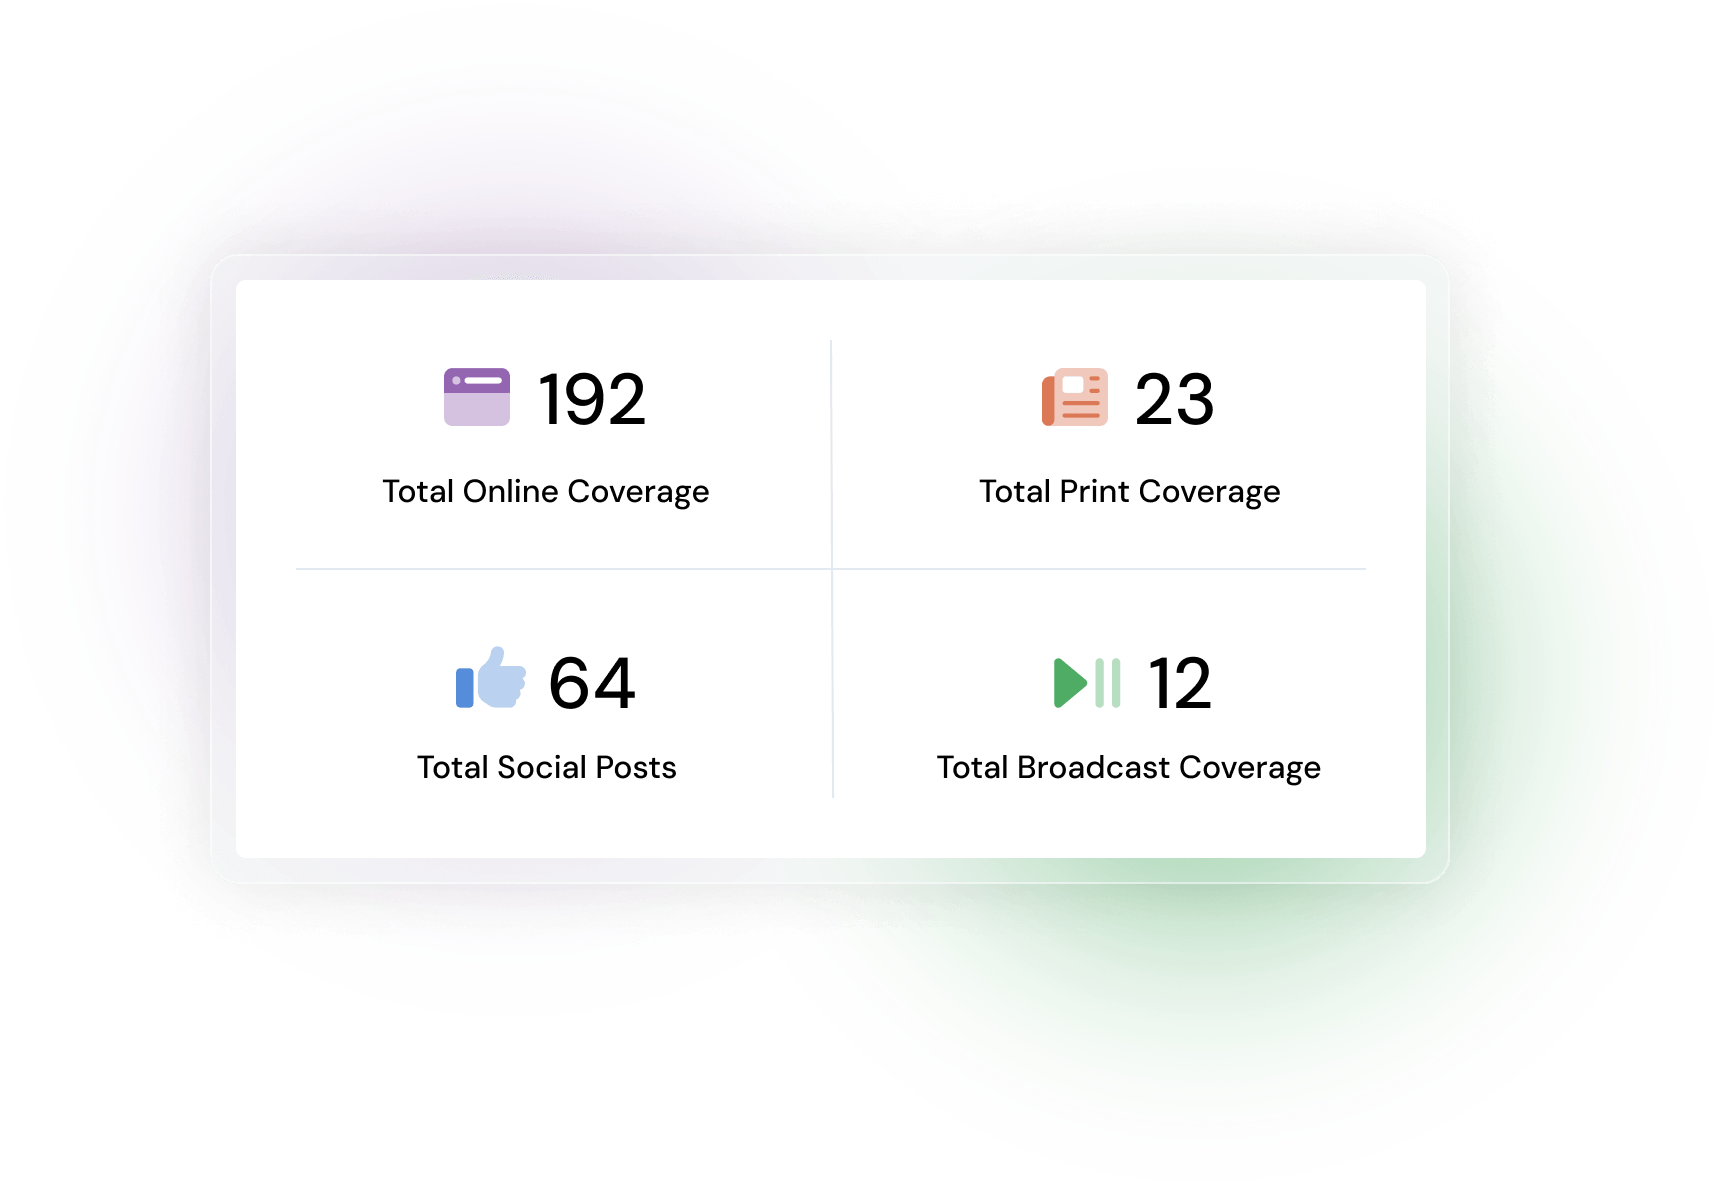
Get totals for each type of coverage - online, social, print, audio and TV - plus a grand total.
Automated data refreshment
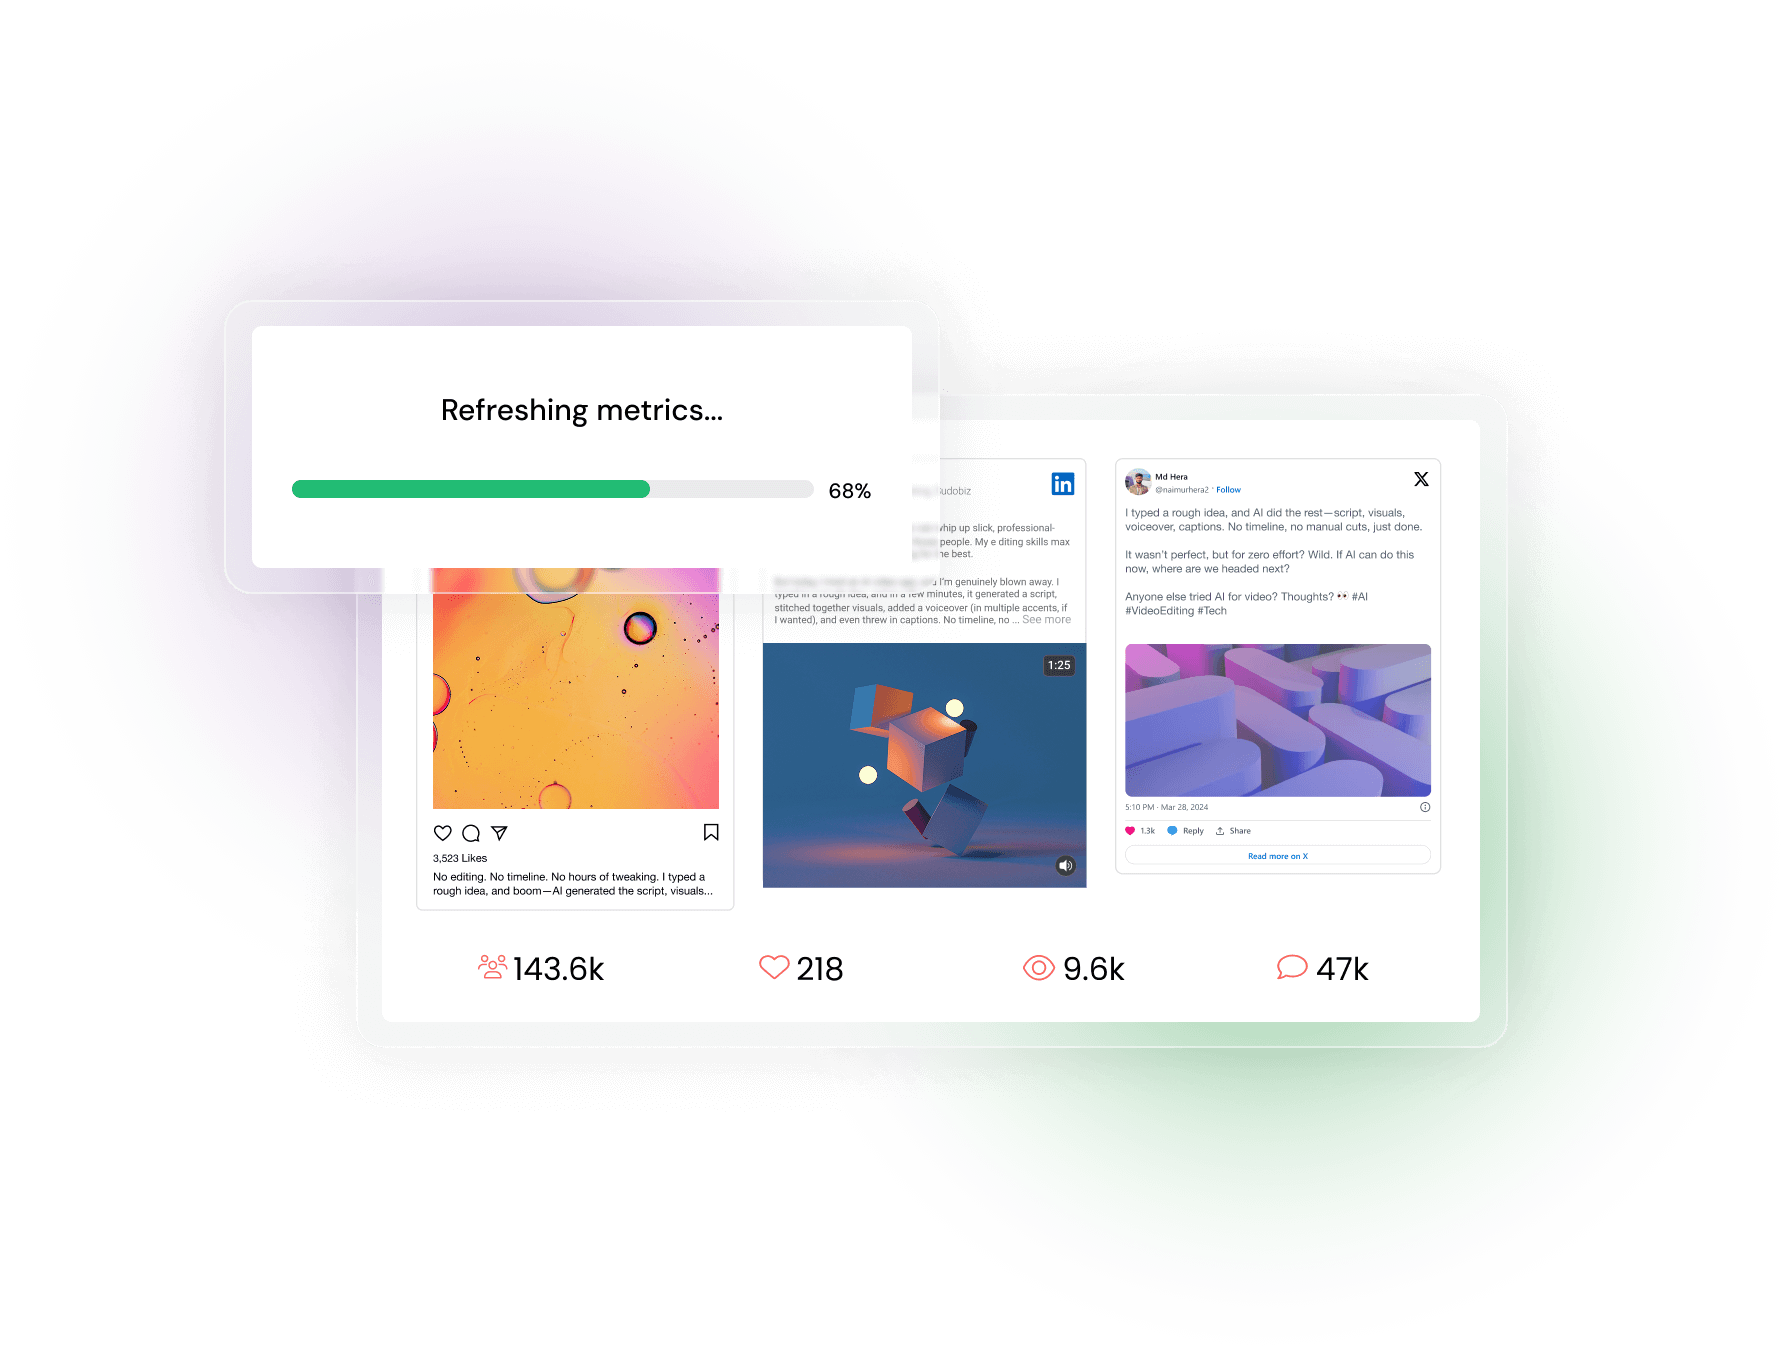
Social media metrics update when reports are published to ensure live, accurate data. Online coverage metrics continue to update for a period of seven days thereafter.
Include custom KPIs
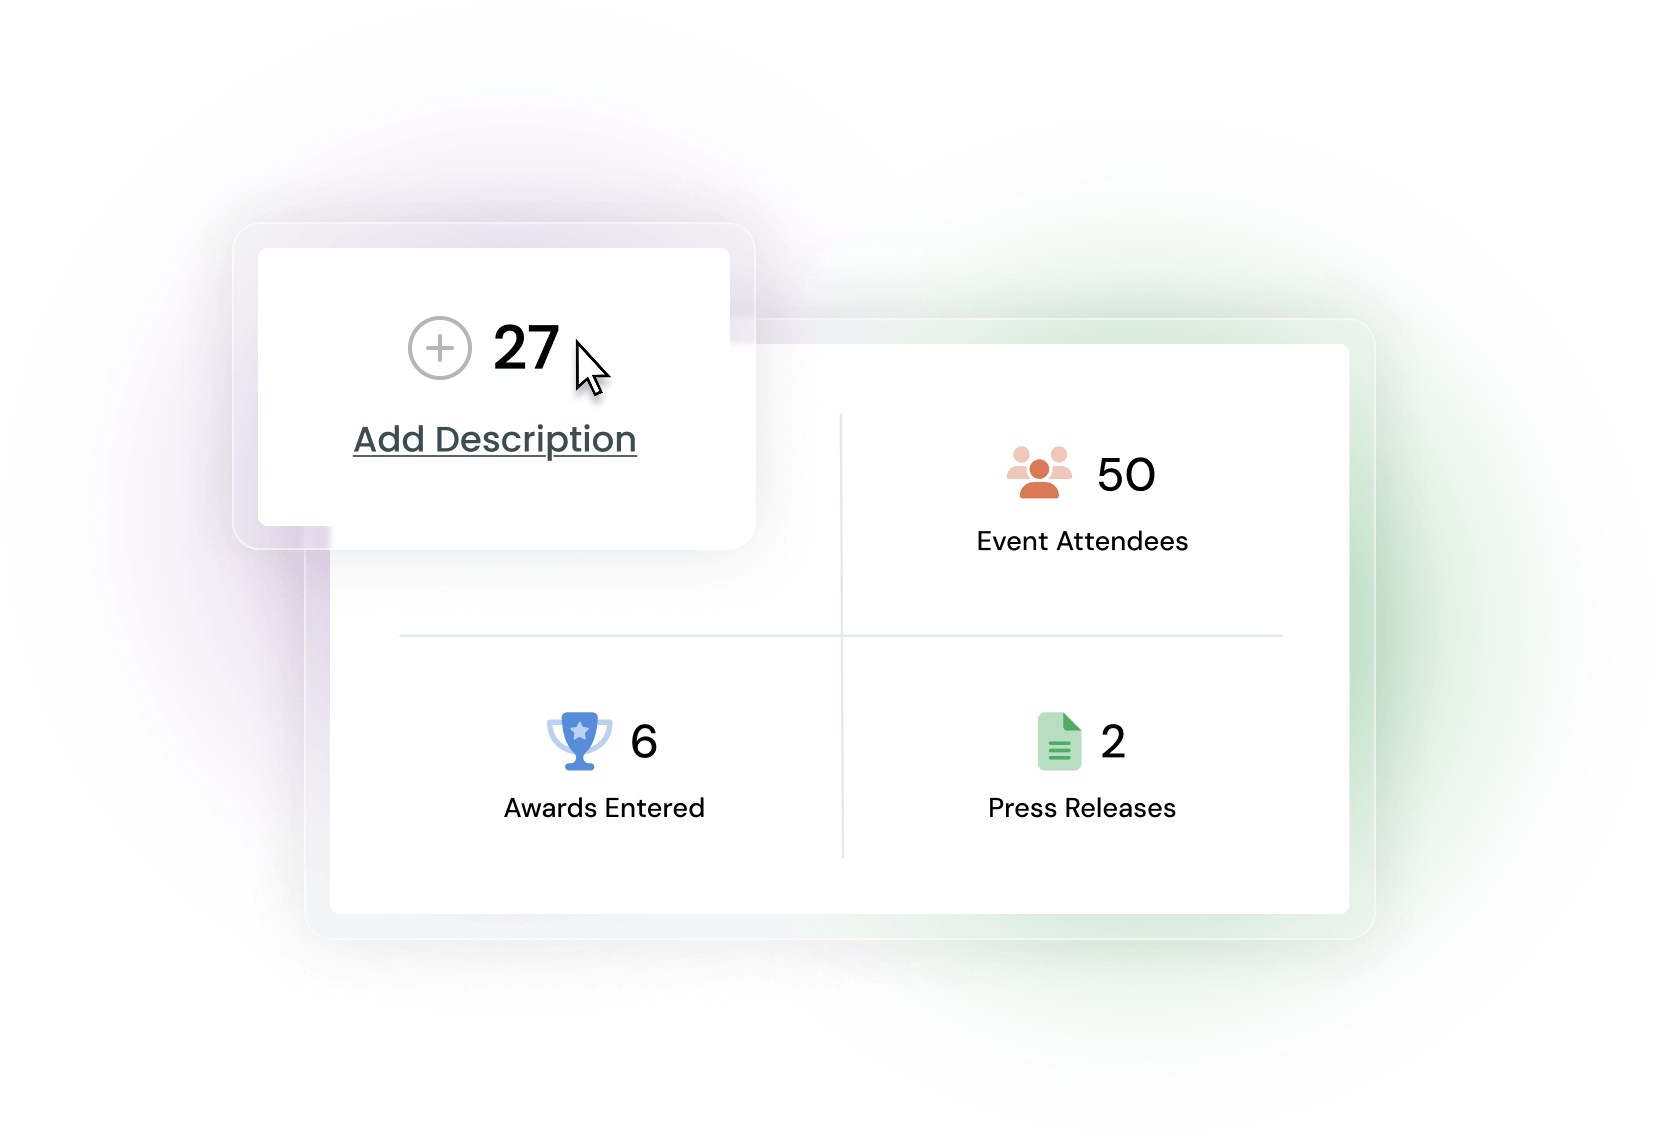
It's easy to add custom data and activity highlights so all bases are covered.
Export to a spreadsheet
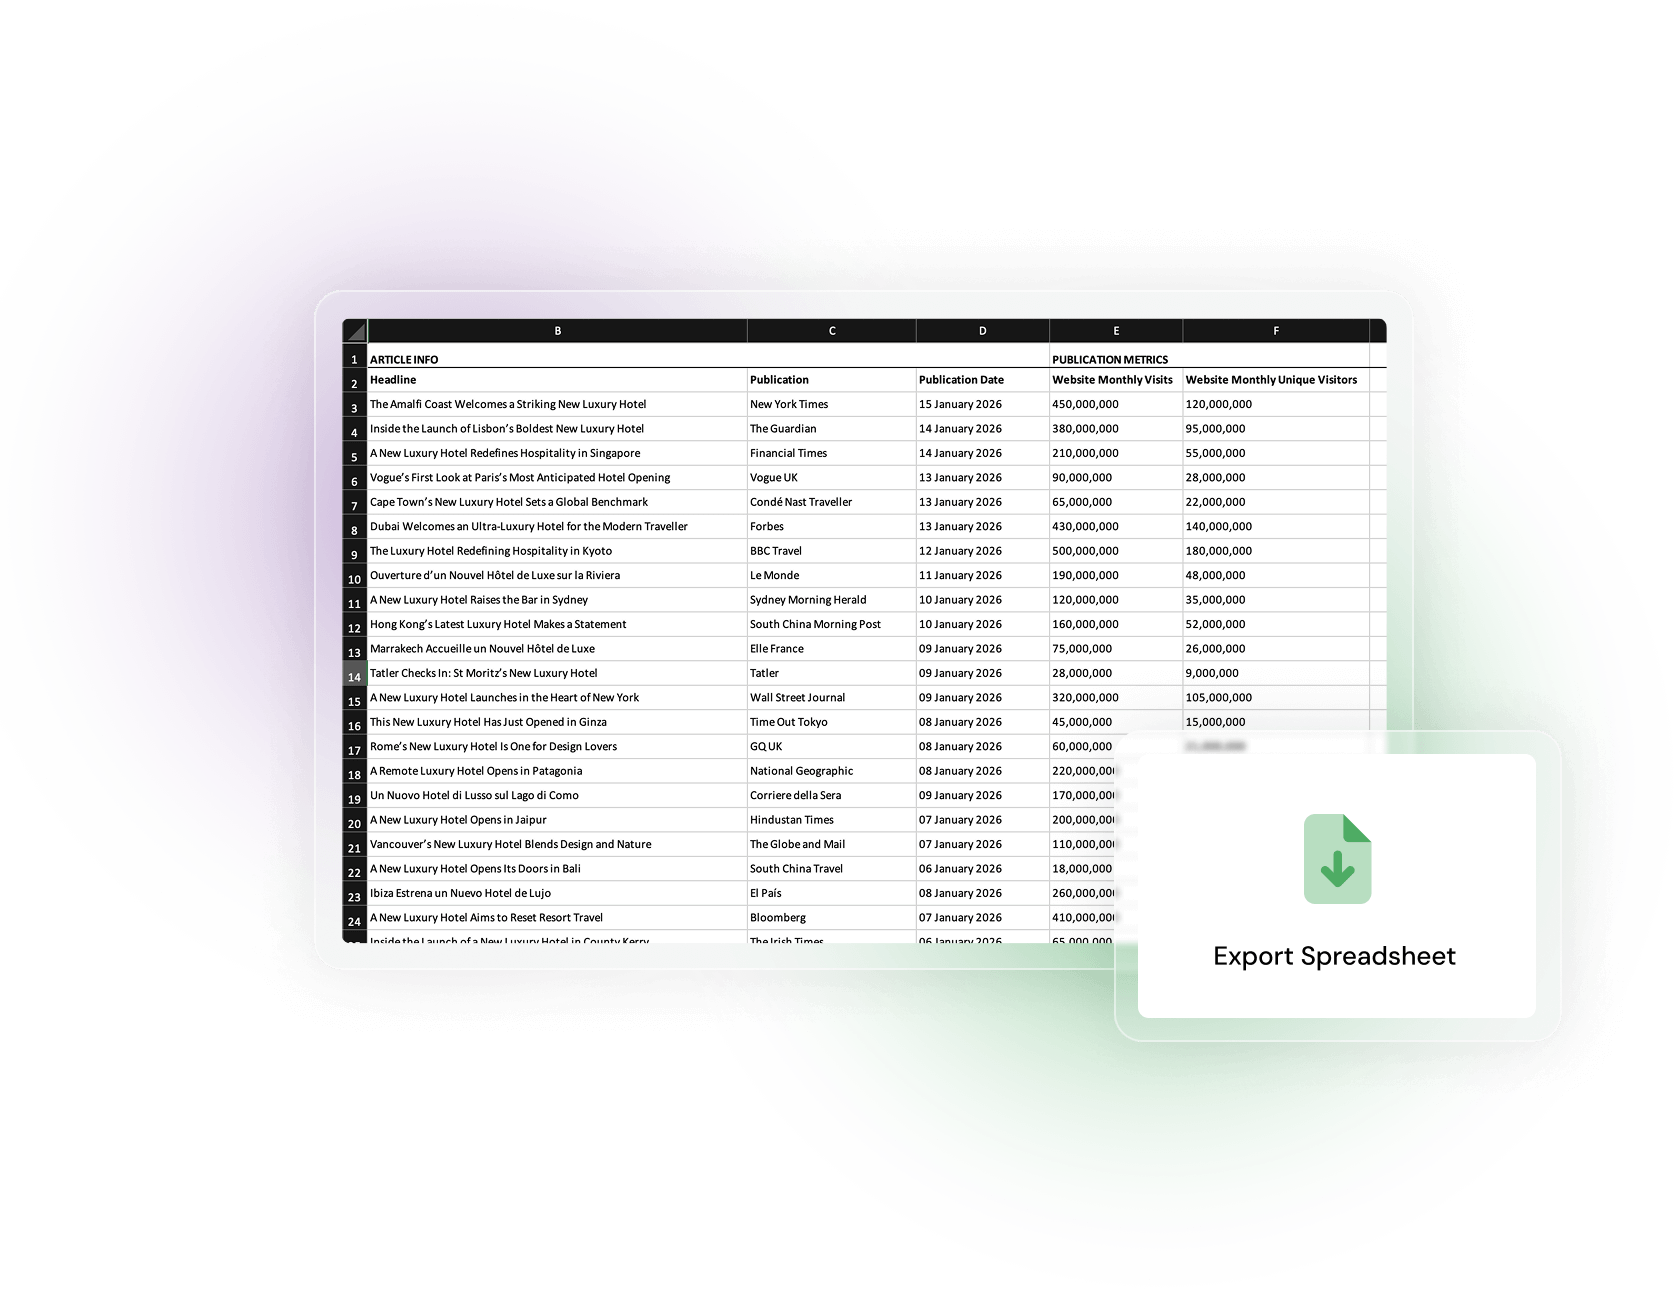
Need to crunch the numbers? Get granular, line by line reporting in the exported spreadsheet.
Ready to prove your PR impact?
Speak to us to cut reporting time and start proving your value today.